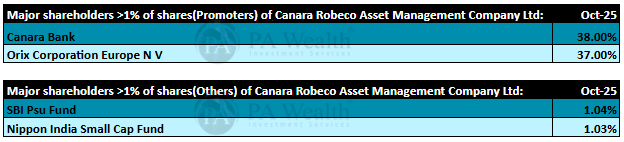
Canara Robeco AMC is a joint-venture between Canara Bank (51%) and ORIX Corporation Europe / Robeco (49%) that manages the Canara Robeco Mutual Fund.
Founded in 1993, it offers a diversified suite of equity, hybrid, and debt schemes while leveraging Canara Bank’s strong retail reach and Robeco’s global asset-management expertise.
- About
- Industry Overview
- Journey
- Board of Directors
- Shareholding Pattern
- Business Segments
- Revenue Segments
- Cost Structure
- Financials
- Management Discussion & Concall
- Strengths & Weaknesses
(A) About Canara Robeco Asset Management Company Ltd. | Stock Analysis
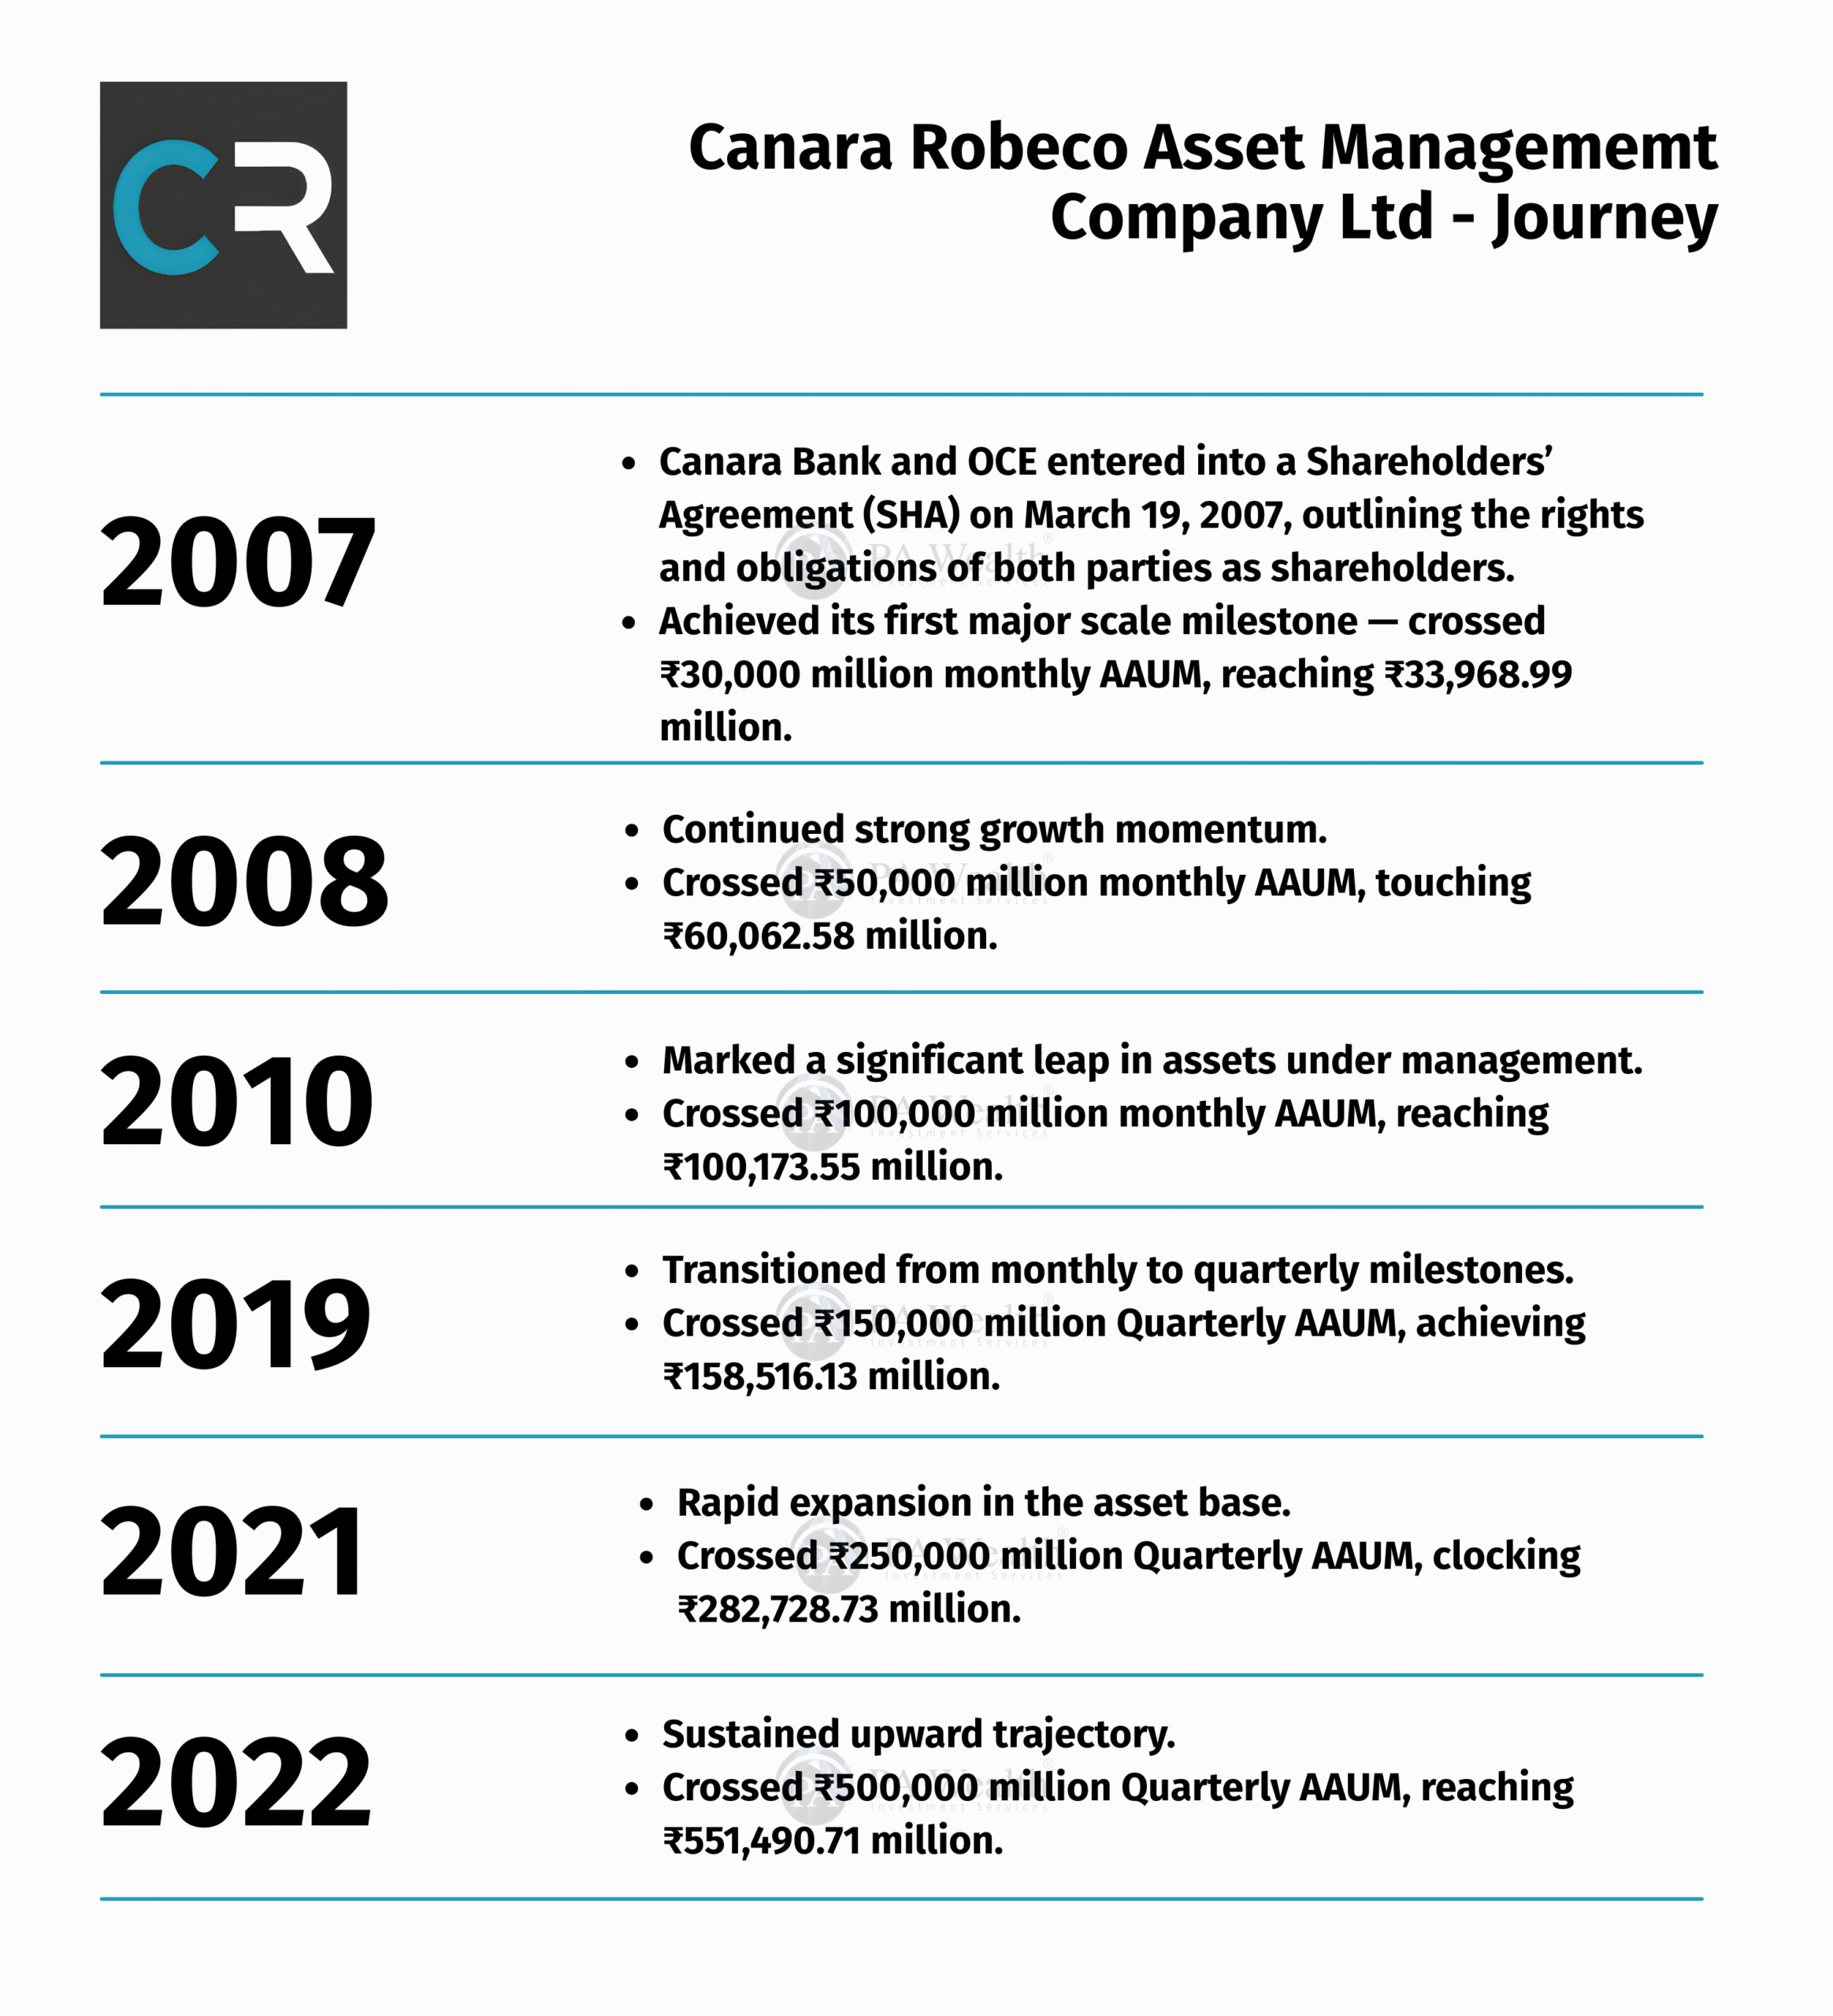
Canara Robeco Mutual Fund is India’s second-oldest mutual fund house, with its journey beginning in December 1987 as Canbank Mutual Fund. Over the years, it built a strong reputation for trust, stability, and investor-focused services. Then, in 2007, Canara Bank entered into a strategic partnership with Robeco—now part of ORIX Corporation, Japan—which brought global investment expertise and a more structured approach to asset management. As a result, the fund house evolved into what we know today as Canara Robeco Mutual Fund.
Since the inception of this partnership, the AMC has grown rapidly and steadily. Its blend of Canara Bank’s extensive domestic presence and Robeco’s international investment capabilities has helped it deliver consistent performance across market cycles. Moreover, the fund house continues to expand its product offerings, strengthen risk-management frameworks, and focus on long-term wealth creation for investors.
Today, Canara Robeco Mutual Fund stands among the fastest-growing AMCs in India in terms of AUM, driven by its disciplined investment philosophy, investor-centric approach, and commitment to sustainable growth.
(B) Industry Overview
- The Indian Mutual Fund industry has witnessed exceptional expansion over the past decade, growing from ₹13.24 trillion in October 2015 to ₹79.88 trillion in October 2025, marking a remarkable 6x increase.
- Over the last five years, the industry AUM surged from ₹28.23 trillion in October 2020 to ₹79.88 trillion in October 2025, reflecting a threefold rise supported by rising incomes, growing awareness, and stronger retail participation.
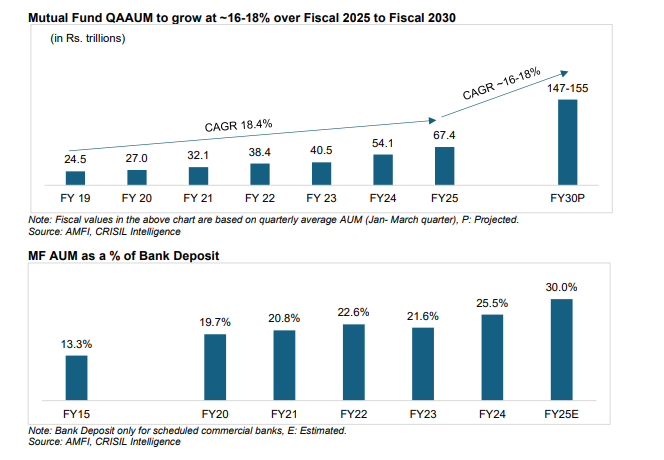
- The MF industry had already grown significantly from ₹24.5 trillion in FY19 to ₹67.4 trillion in FY25, driven by sustained equity flows, expanding distribution networks, and deeper penetration into B-30 cities.
- The latest monthly snapshot shows strong momentum continuing, with AAUM of ₹79.79 trillion in October 2025, indicating consistently high investor activity and stable inflows.
- The industry has also crossed major structural milestones over the years — ₹10 trillion AUM in 2014, ₹20 trillion in 2017, and ₹30 trillion in 2020 — demonstrating a steady and reliable growth trajectory.
- Investor participation has widened enormously, with total folios rising from 10 crore in May 2021 to 25.60 crore (256 million) by October 2025, reflecting deeper financialisation across India.
- Of these, 19.98 crore folios belong to equity, hybrid, and solution-oriented schemes, underscoring a sustained shift toward long-term, market-linked wealth creation.
- Supporting this growth, the ICICI Prudential report highlights rising demat accounts (from 35.9 million in FY19 to 192.4 million in FY25) and rapid digitisation as key enablers of market penetration.
- Looking ahead, industry AUM is projected to grow at 16–18% CAGR through FY30, with expectations of reaching ₹147–155 trillion, positioning India among the fastest-growing mutual fund markets globally.
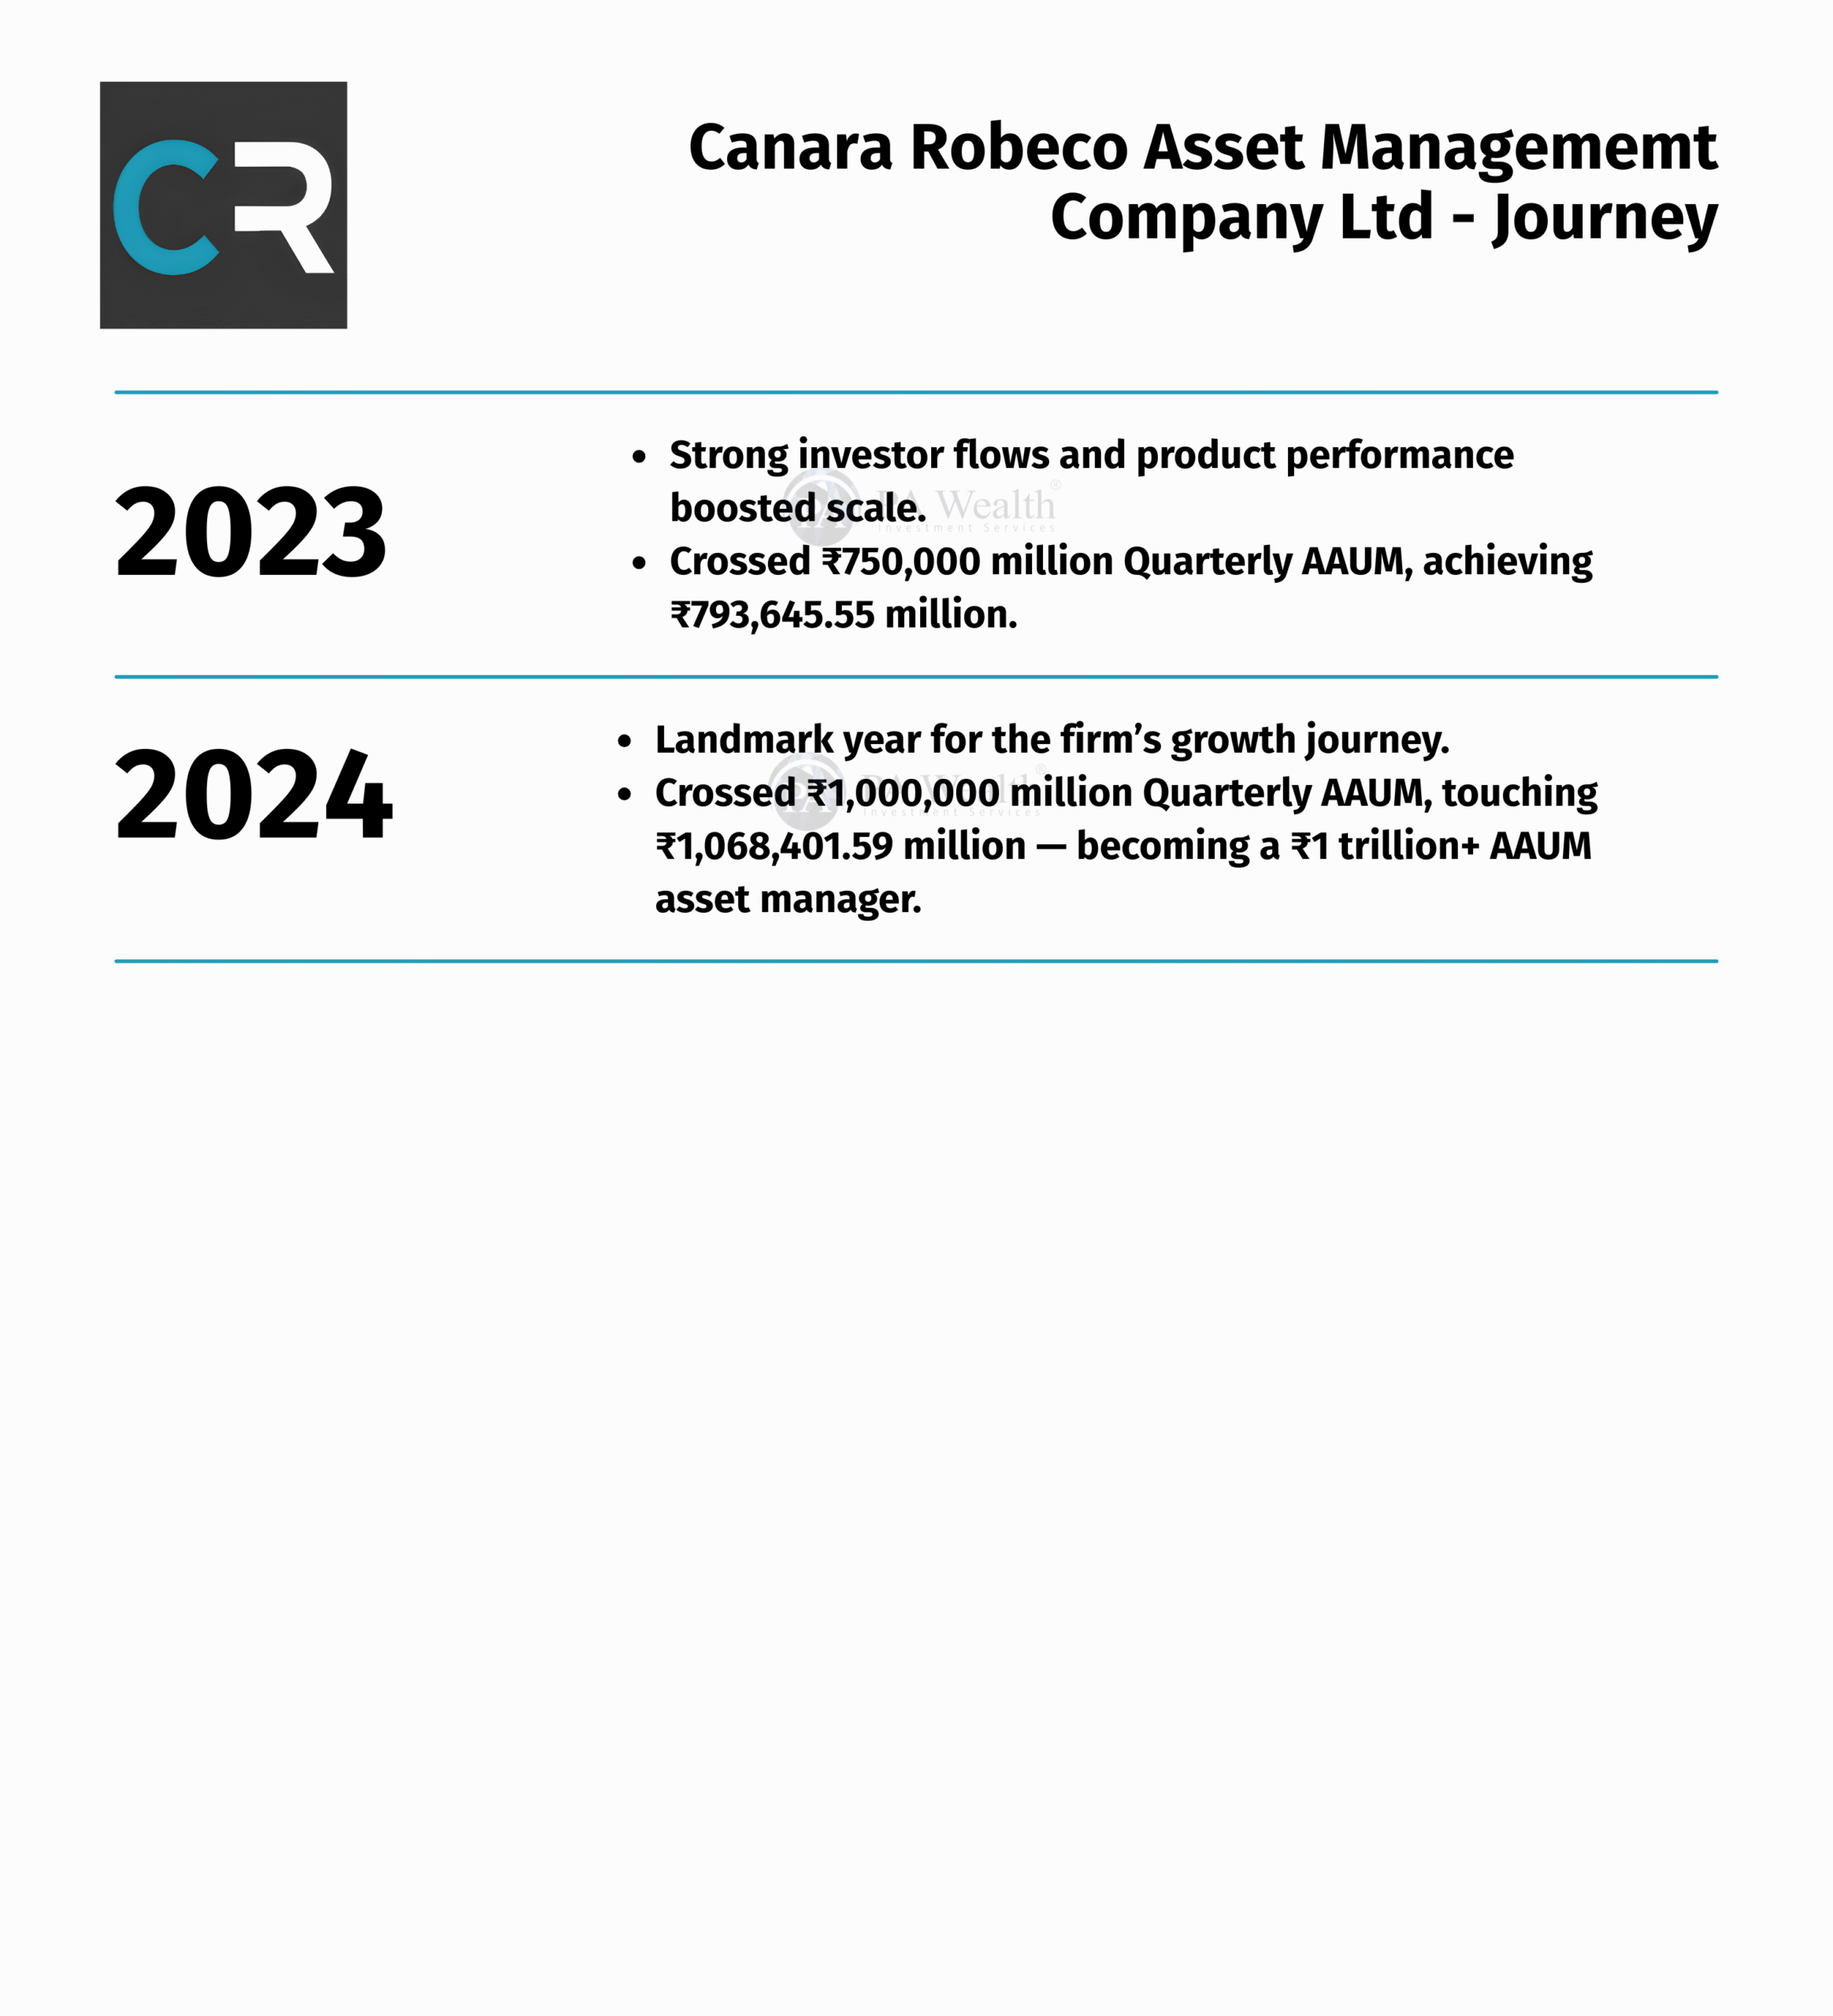
(C) Journey
(D) Board of Directors of Canara Robeco Asset Management Company Ltd


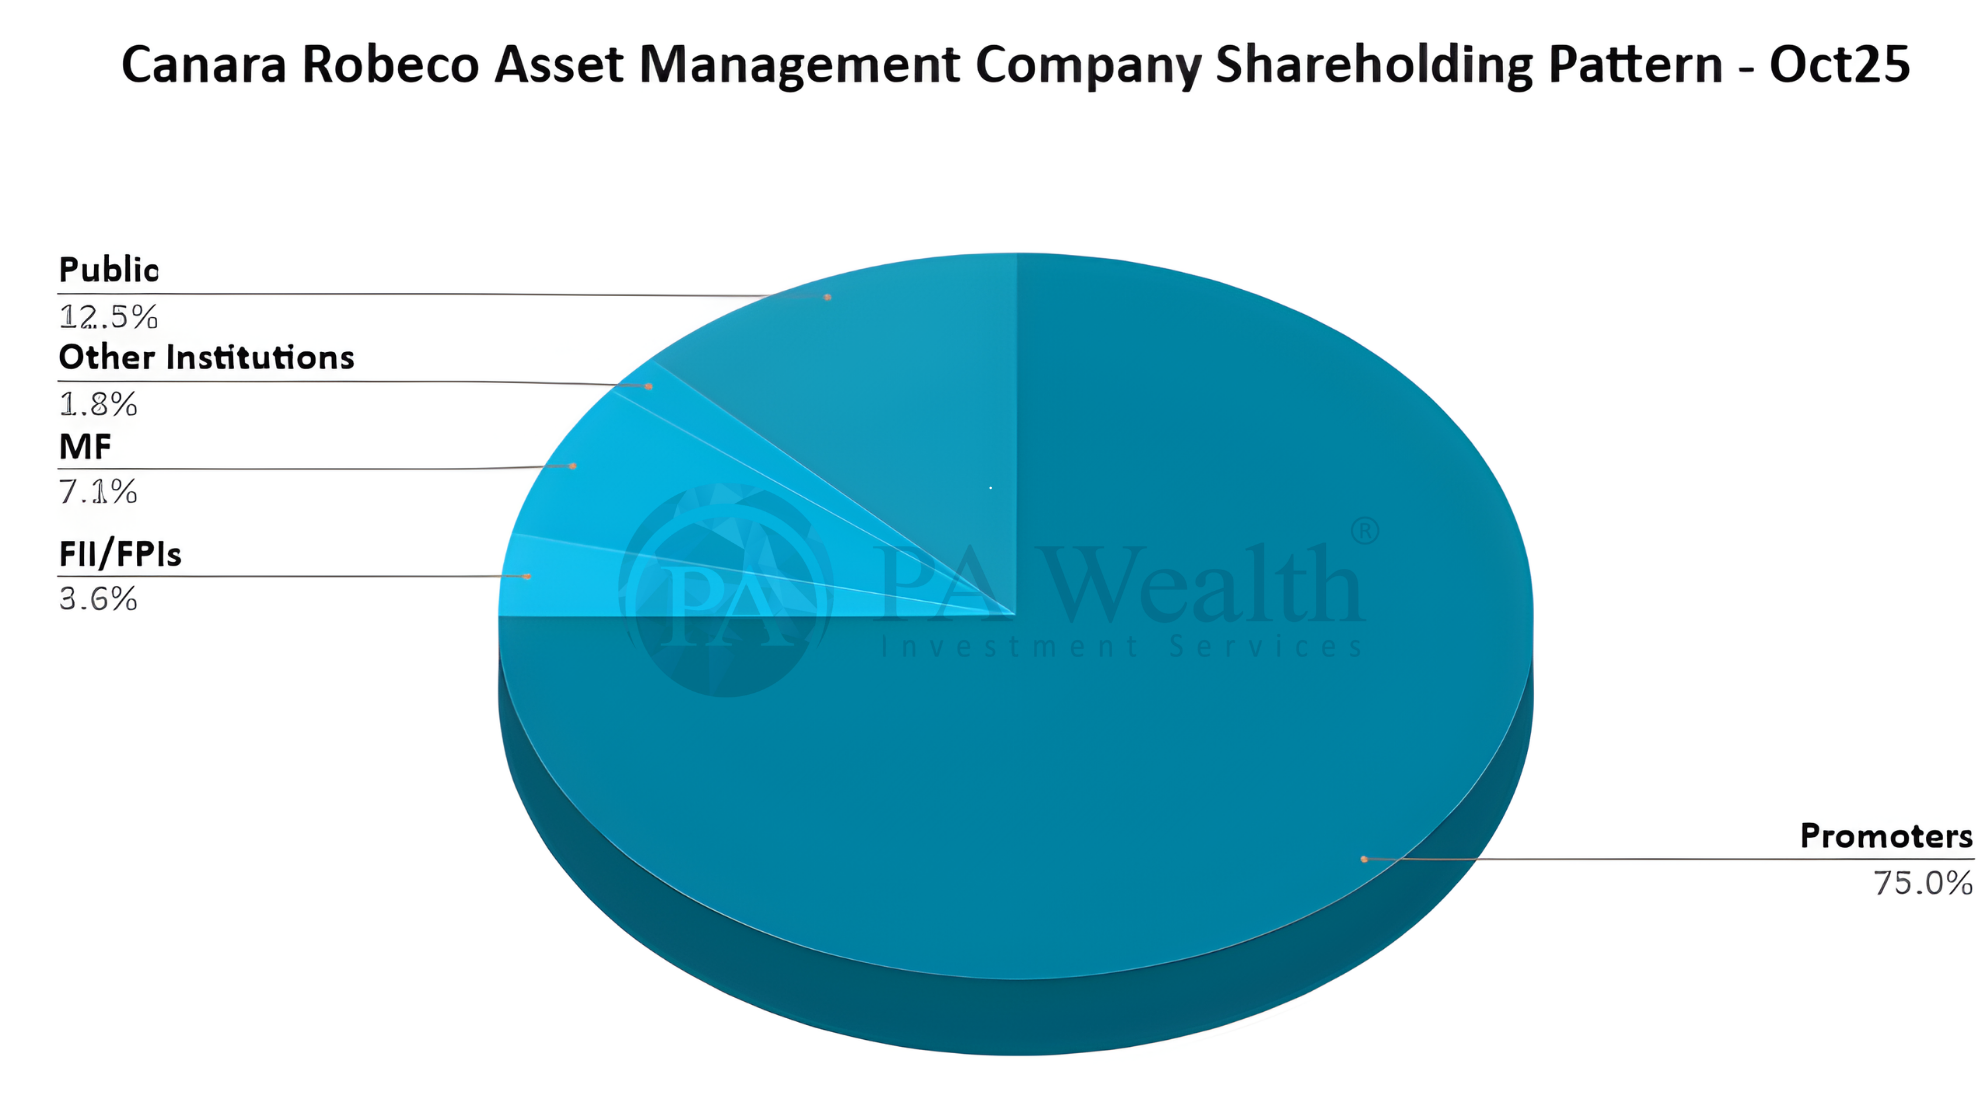
(E) Shareholding Pattern of Canara Robeco Aseset Management Company Ltd.
(F) Business Segments of Canara Robeco Aseset Management Company Ltd. | Stock Analysis
1.Mutual Fund Management
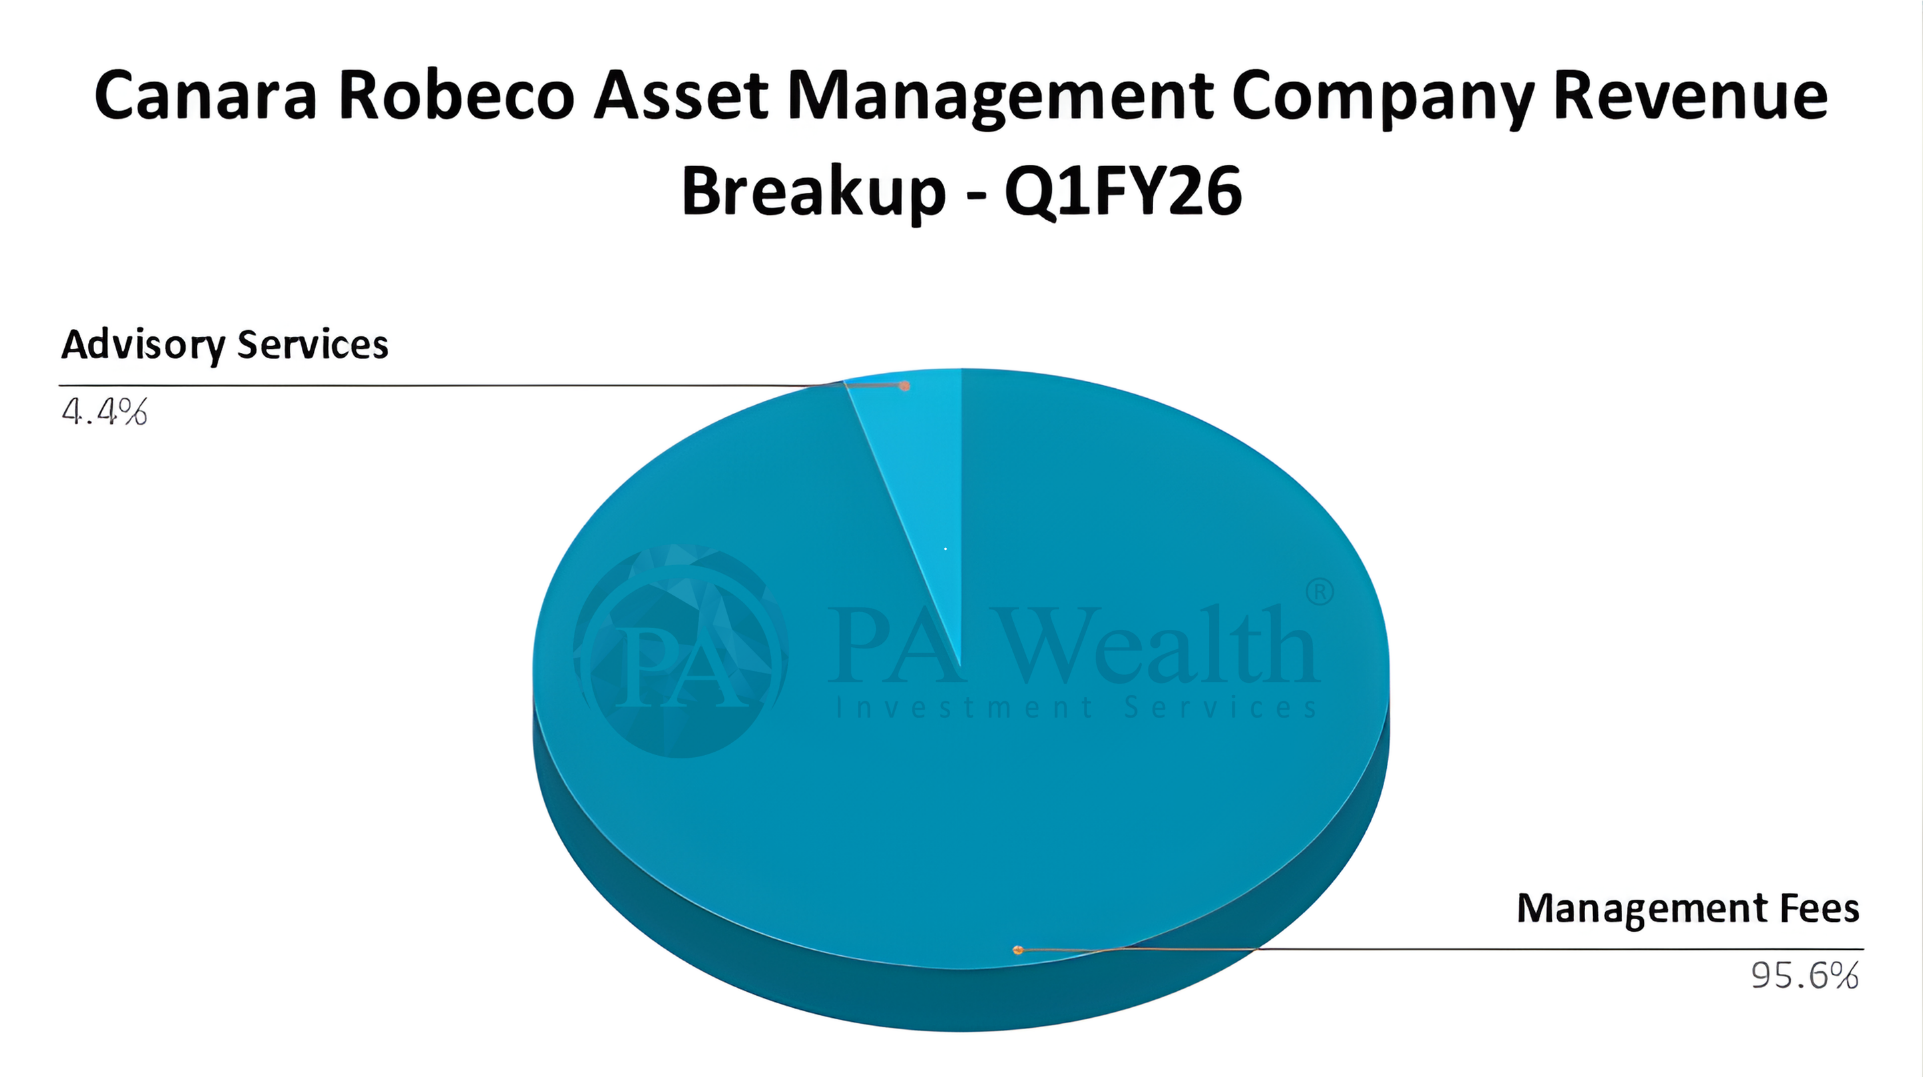
This is the company’s primary business, where it manages a broad range of mutual fund schemes across equity, debt, and hybrid categories. The AMC is responsible for research, portfolio construction, risk management, and day-to-day fund operations, serving retail, HNI, and institutional investors. Revenue is mainly earned through management fees linked to the assets under management (AUM).
2. Investment Advisory Services
Canara Robeco AMC also provides investment advisory services, primarily offering equity research, portfolio strategy, and investment recommendations to Robeco Hong Kong Ltd., part of the promoter group. This segment generates fee-based income and leverages the AMC’s expertise in Indian capital markets to support offshore mandates and global investment strategies.
(G) Revenue Mix of Canara Robeco Asset Management Company Ltd. | Stock Analysis
(i) Business Revenue Mix
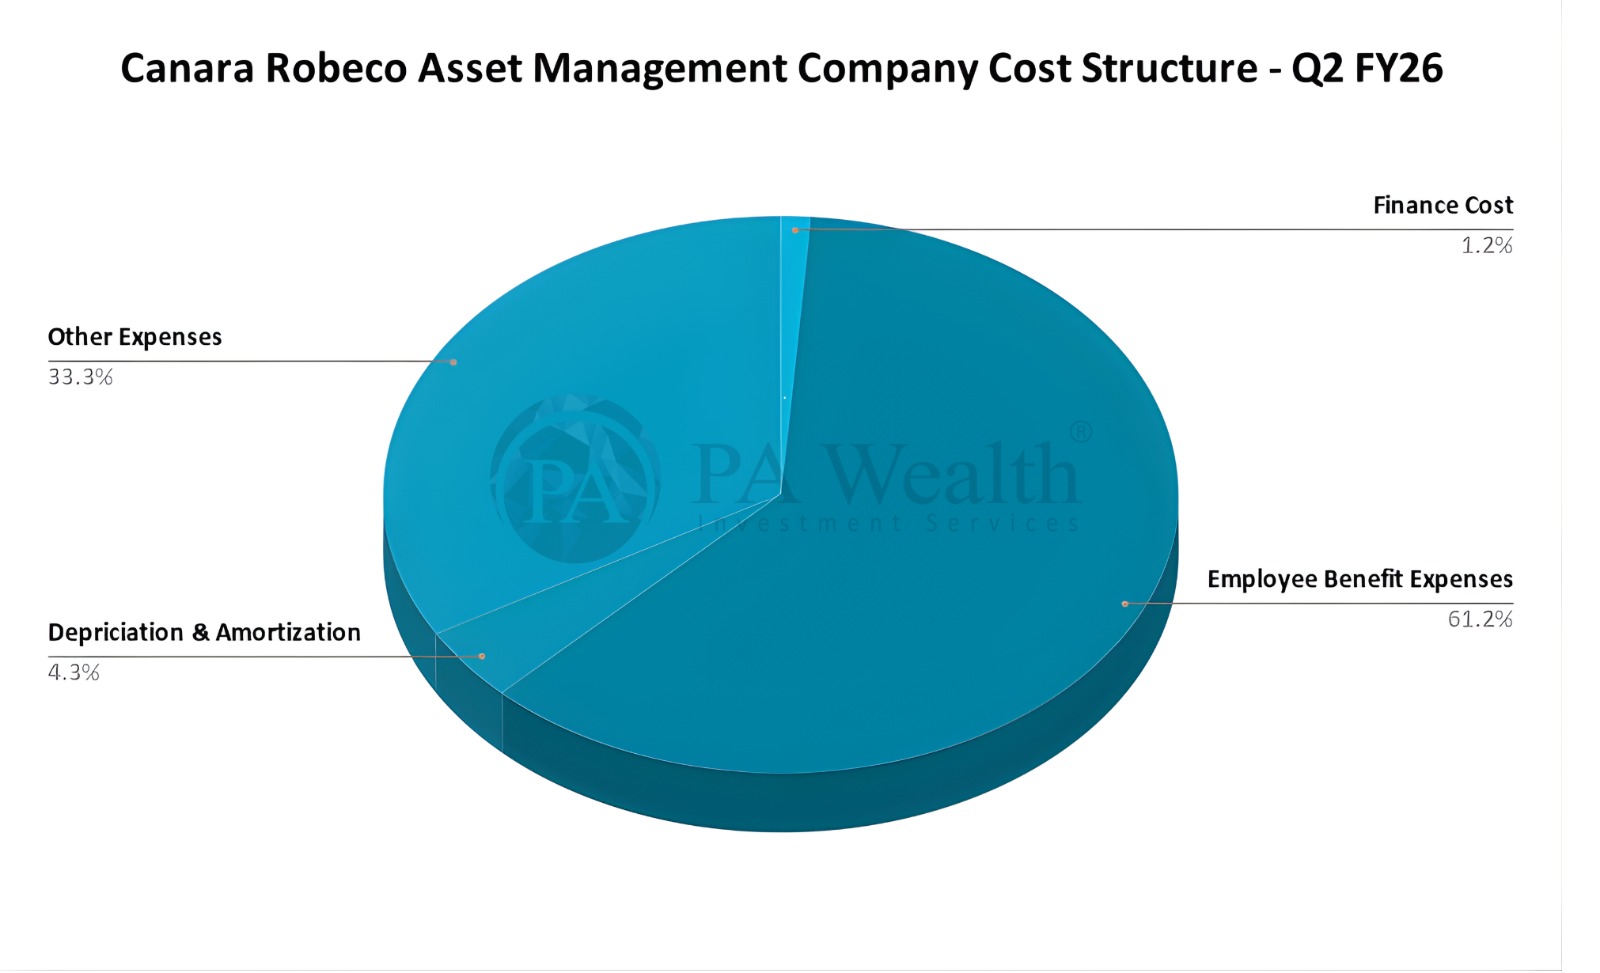
(H) Cost Structure of Canara Robeco Asset Management Company Ltd.
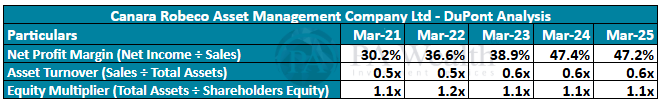
(I) Financials of Canara Robeco Asset Management Company Ltd.
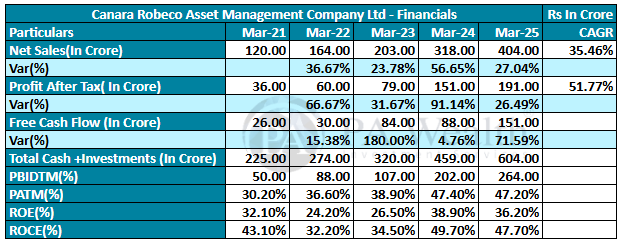
 Revenue grew strongly at a 35%+ CAGR, indicating consistent AUM expansion and better equity mix.
- Moreover, PAT grew even faster at 52% CAGR, showing the classic operating-leverage advantage of an AMC.
- As a result, profit margins expanded sharply, with PATM rising from 30% to 47%, reflecting disciplined costs and scalable business model.
- In addition, free cash flow jumped significantly—especially in FY23 and FY25—because higher profits translated almost fully into cash due to the asset-light nature of AMCs.
- Furthermore, cash & investments climbed steadily to ₹604 Cr, highlighting strong internal accruals and limited capex needs.
- At the same time, PBIDT increased from ₹50 Cr to ₹264 Cr, confirming that core operating profitability scaled consistently with AUM.
- Likewise, return ratios such as ROE and ROCE remained very high despite fluctuations, reinforcing the efficiency and capital-light structure of the AMC business.
- Overall, the financials show a business benefiting from rising AUM, improving margins, strong cash generation, and minimal reinvestment—typical traits of a well-run AMC.
(J) Management Discussion & Concall | Stock Analysis
-
First, overall performance is driven mainly by scheme composition and returns — strong investment performance boosts AUM growth, client retention, and fee income.
-
Moreover, the AMC manages a diversified set of 26 schemes but remains equity-heavy; equity QAAUM surged from ₹552.53 bn (FY23) to ₹947.57 bn (FY25), lifting equity mix above 91% and positioning the firm among the top in equity share across major AMCs.
-
Additionally, its research-driven investment framework — combining macro analysis, sector tracking, and stock-level fundamentals — supports consistent scheme performance.
-
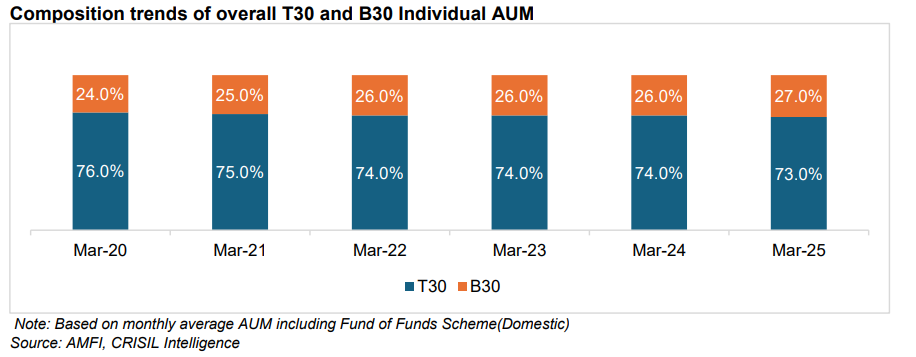
Furthermore, distribution strength remains a key growth driver; the company operates 25 branches, works with 52,343 distributors, and holds one of the highest B-30 AUM shares among large AMCs.
-
At the same time, digital initiatives like mobile apps, online investments, eKYC, and the smarT MFD portal enhance investor convenience and empower distributors through seamless, paperless processes.
-
However, macroeconomic and global trade conditions significantly influence investor sentiment, household savings, and inflows/redemptions — with interest rates, inflation, and US–India trade tensions shaping mutual fund demand.
-
Finally, the AMC faces intense competition from other mutual funds, banks, insurers, ETFs, and new entrants offering lower fees, broader product suites, and wider digital reach — putting pressure on market share and operating costs.
Growth Outlook
-
CRAMC is building for ~20% AUM growth, driven by stronger operating income, distribution reach, and upcoming NFOs.
-
Equity-heavy AUM mix (~90%) supports long-term profitability, with SIP flows (>21 lakh SIPs) providing steady annuity growth.
-
B-30 expansion continues with rising average AUM (₹288 cr vs ₹261 cr YoY), strengthening retail depth.
-
Operating leverage remains a major driver—management expects incremental revenue to directly enhance PAT.
-
Two new funds—Banking & Financial Services and Innovation Fund—are positioned as near-term growth catalysts (Q4 FY26/Q1 FY27 launches).
-
Long-term performance focus, prudent risk management, and disciplined portfolio liquidity strengthen the foundation for sustained scale-up.
-
Management expects direct channel share to rise gradually, improving investor outcomes without impacting AMC yields.
-
Overall growth remains market-dependent, but internal planning and business levers point to sustained double-digit AUM compounding.
Q2 FY26 Concall Highlights
-
The revenue dip this quarter happened only because their own investments saw lower market gains; this is a normal fluctuation and not linked to business performance. Core operating income actually grew 7% QoQ.
-
Operating profitability stayed robust, with margins holding at 58–59%. The team reiterated that operating income—not reported revenue—is the right metric to judge business momentum.
-
Cost discipline remained a key theme, with the company maintaining its 12–15% opex growth guidance and reaffirming a 30–40% cost-to-income comfort zone for Indian AMCs.
-
On pricing, management reiterated a blended 30–40 bps yield band, adding that minor yield compression is acceptable if it adds directly to the bottom line.
-
The call also clarified that management fees are identical for direct and distributor channels; only investors benefit from lower TER in direct plans, not the AMC.
-
Regarding regulations, SEBI’s recent consultation paper (including the potential 5 bps cut) remains under discussion. CRAMC noted that the eventual impact will depend on how the industry chooses to pass it through.
-
On treasury deployment, management highlighted that around ₹92–94 crore is invested as mandatory “skin-in-the-game” capital, with the rest allocated to liquid and overnight instruments.
-
ESOPs: A 2% equity pool has been approved, with initial grants priced near ₹259.5 and a minimal P&L impact expected for FY26.
-
While not sharing flow numbers, the team indicated that overall flows and mix trends are generally aligned with industry patterns.
-
On branding and ownership, management acknowledged a potential future brand transition due to Robeco’s ownership structure, and noted Canara Bank must reduce its stake to 30% or below by Oct 2029, per RBI requirements.
(K) Strengths & Weaknesses
Strengths
-
Strong parentage and brand credibility backed by Canara Bank and ORIX, which enhances trust and distribution reach.
-
High operational efficiency, reflected in disciplined cost management and strong profitability.
-
Equity-focused product mix, supported by a research-driven investment process that appeals to long-term investors.
-
Retail-heavy investor base, leading to more stable, sticky inflows through SIPs.
-
Wide multi-channel distribution network leveraging bank branches, independent financial distributors, and digital platforms.
-
Strong AUM growth momentum, supported by market positioning and consistent investor inflows.
Weaknesses
-
High dependence on equity markets, making revenue and AUM vulnerable during market corrections.
-
Limited institutional AUM, creating higher reliance on retail flows and potentially lower ticket sizes.
-
Heavy dependence on third-party distributors, where losing key partners can impact inflows.
-
No fresh capital from IPO, limiting immediate expansion flexibility since the offer is entirely a sale by existing shareholders.
-
Concentration risk, with AUM skewed towards specific categories, making performance sensitive to category trends.
-
Geographic concentration, with a significant share of the business coming from a few regions.
Drop us your query at – info@pawealth.in or Visit pawealth.in
References: Annual Reports, News Publications, Investor Presentations, Corporate Announcements, Management Discussions, Analyst Meets and Management Interviews, Industry Publications.
Disclaimer: The report only represents the personal opinions and views of the author. No part of the report should be considered a recommendation for buying/selling any stock. Thus, the report & references mentioned are only for the information of the readers about the industry stated.
Most successful stock advisors in India | Ludhiana Stock Market Tips | Stock Market Experts in Ludhiana | Top stock advisors in India | Best Stock Advisors in Gurugram | Investment Consultants in Ludhiana | Top Stock Brokers in Gurugram | Best stock advisors in India | Ludhiana Stock Advisors SEBI | Stock Consultants in Ludhiana | AMFI registered distributor | Amfi registered mutual fund | Be a mutual fund distributor | Top stock advisors in India | Top stock advisory services in India | Best Stock Advisors in Bangalore