- About
- Industry Overview
- Journey
- Board of Directors
- Shareholding Pattern
- Business Segments
- Cost Structure
- Financials
- Management Discussion & Concall
- Strengths & Weaknesses
(A) About Punjab National Bank Ltd. | Stock Analysis
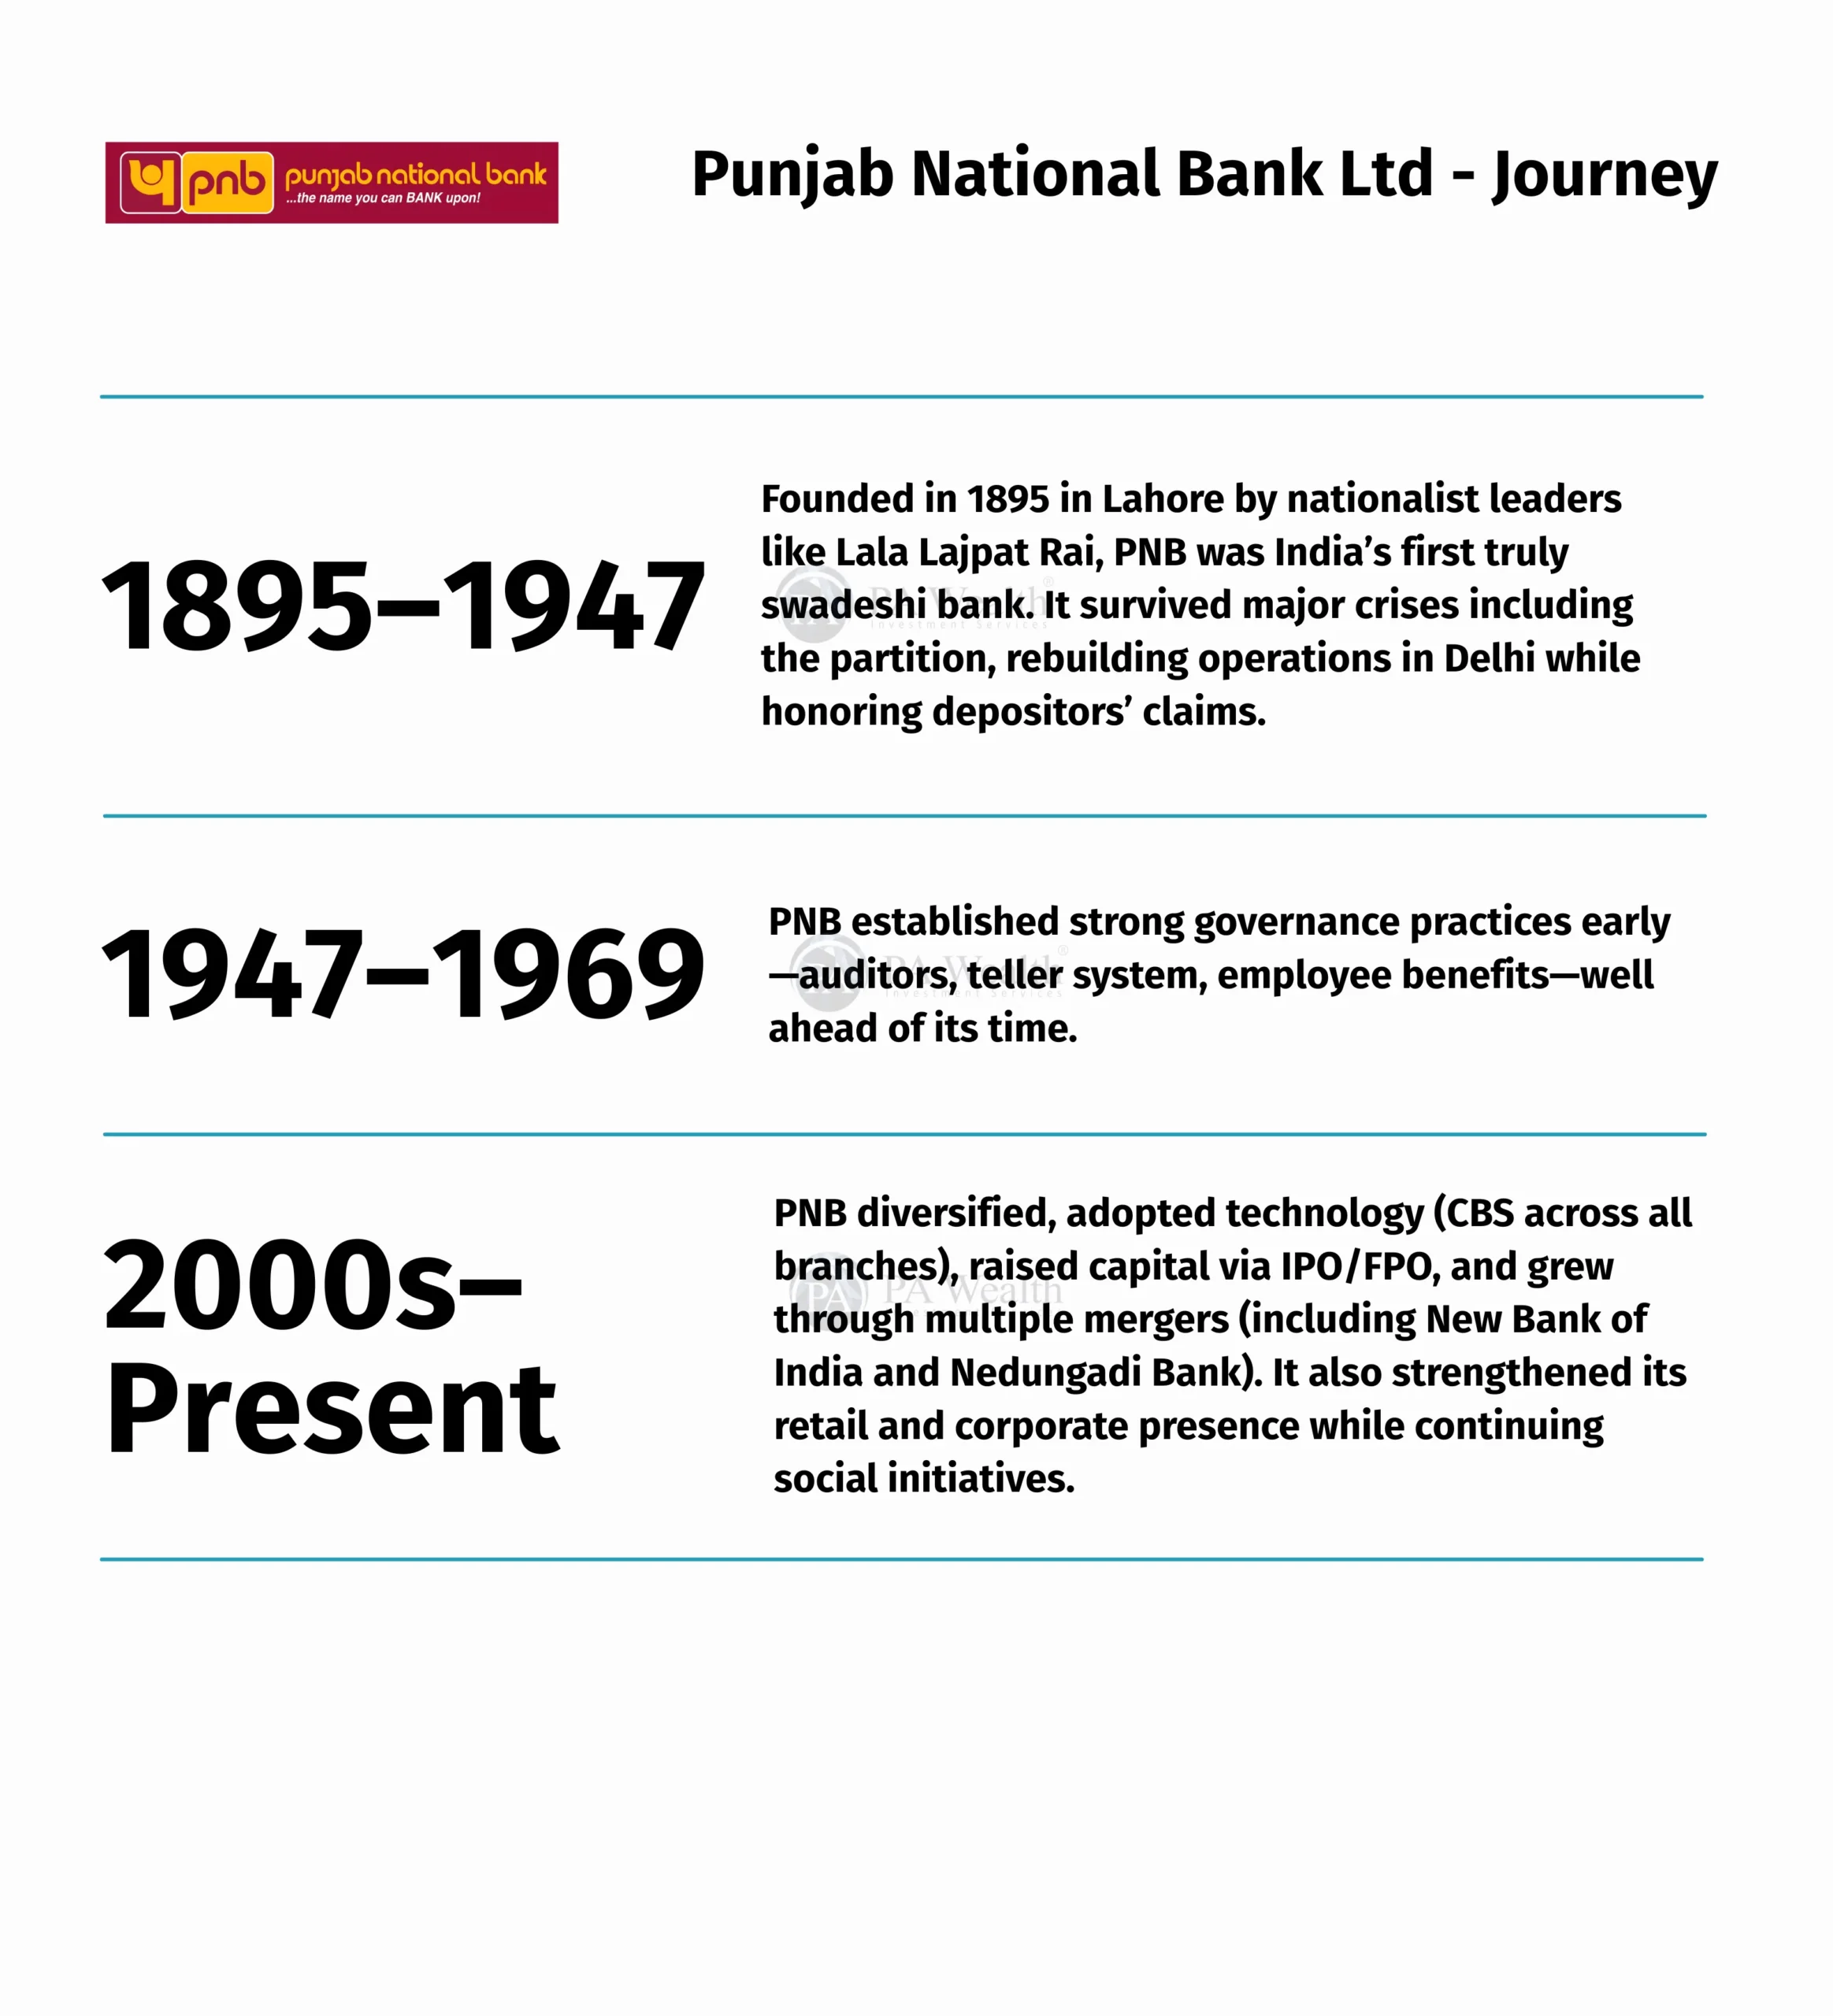
Founded in 1894, Punjab National Bank (PNB) is one of India’s largest public sector banks and the third-largest PSU bank by total business. The bank offers a wide range of banking and financial services across Retail, Corporate, MSME, Agriculture and Digital banking segments. Following the amalgamation of erstwhile Oriental Bank of Commerce and United Bank of India in 2020, PNB significantly expanded its scale and national presence.
(B) Industry Overview
- After the global financial crisis of 2008 – 2009 Indias fiscal and monetary policies helped cushion the impact. But the following years saw a “Twin Balance Sheet problem” due to rising NPAs of the banks the and failure of payment by the corporates(Overleveraged corporates). It soon became a major economic challenge.
- yet what followed was the turining of crisis into an opportunity guided by the principle of “never waste a good crisis” in last 10 years a series of deep structural reforms began aimed to restoring the financial health and lomng term stability of the financial system.
- Now 10 years later banks are much stronger and mature than they were a decade ago and have turned the “twin Balance sheet problem” into “twin balamce sheet advantage”.
- Bank deposits and credit (domestic) have nearly tripled between 2015 and 2025, with deposits rising from ₹88.35 lakh crore to ₹231.90 lakh crore and credit expanding from ₹66.91 lakh crore to ₹181.34 lakh crore.
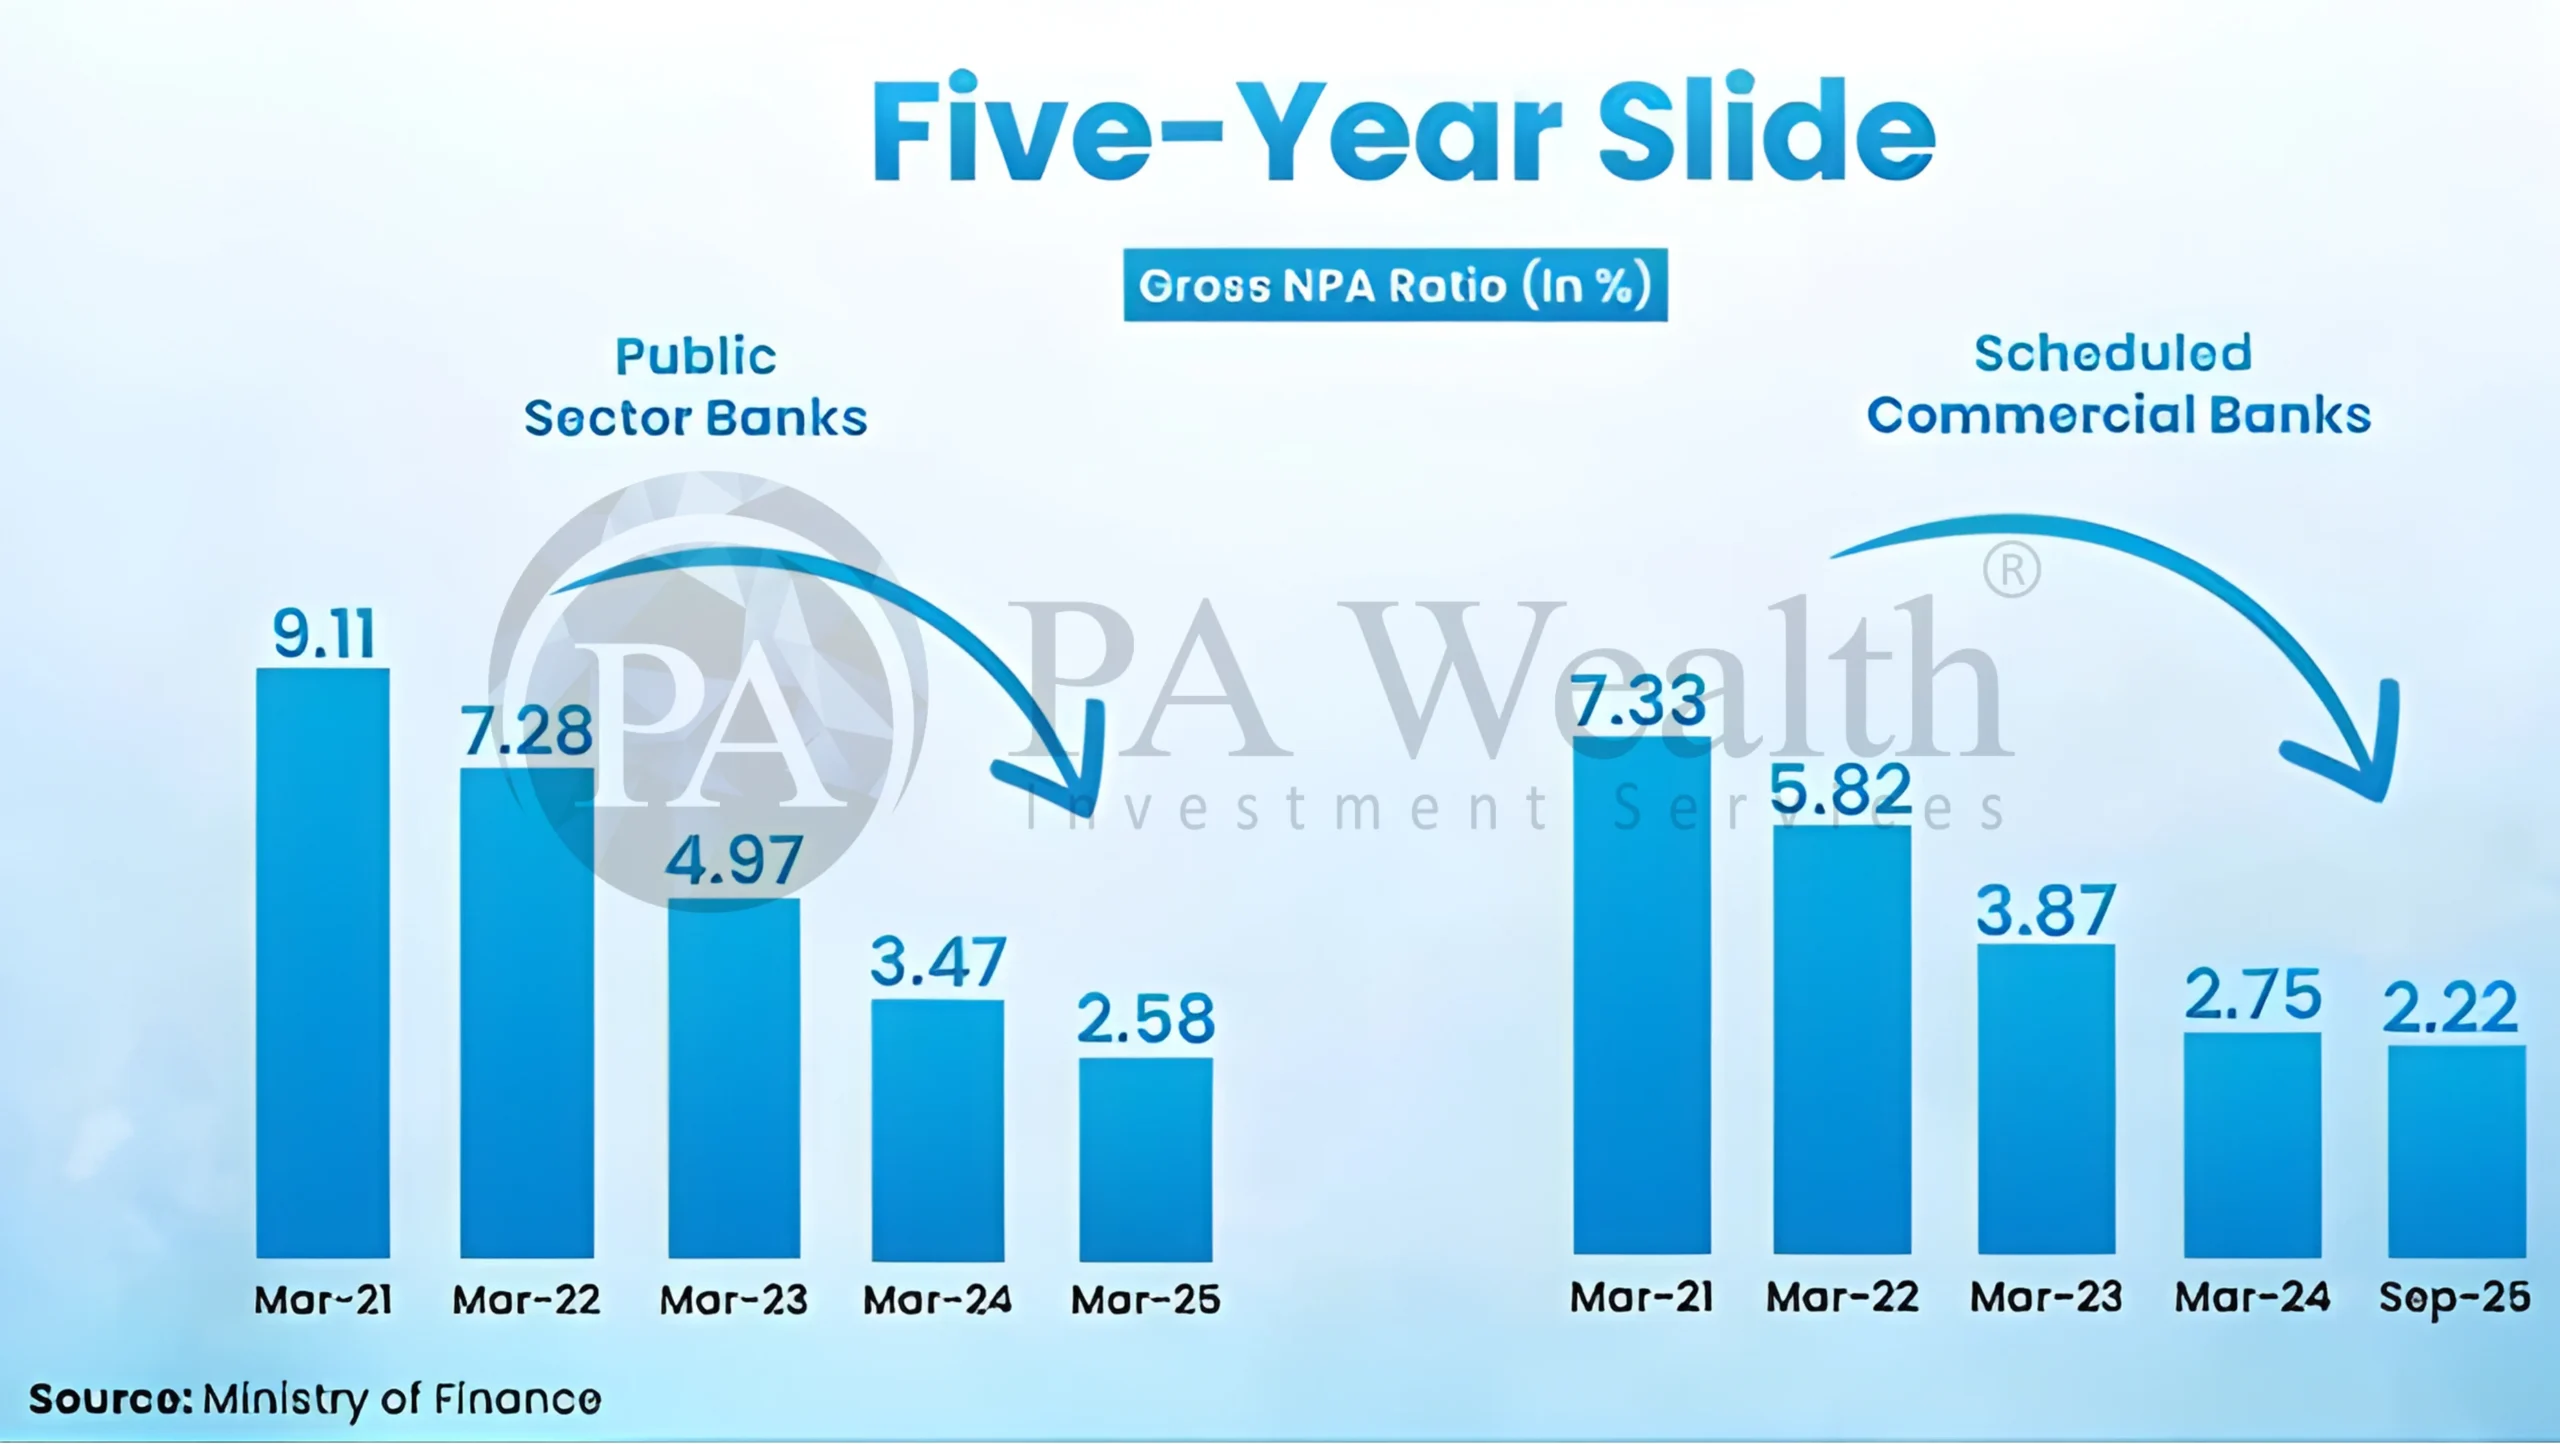
- Asset quality has also improved. Gross Non-Performing Assets (GNPA) and Net Non-Performing Assets (NNPA) have reduced to 2.2% and 0.5% in March 2025 after rising to highs of 11.18% and 5.94% respectively in March 2018.
- The Indian banking industry has seen robust growth, driven by strong economic expansion, rising disposable incomes, growing consumerism, and easier credit access. Digital modes of payments, dominated by UPI, have grown by leaps and bounds over the last few years.
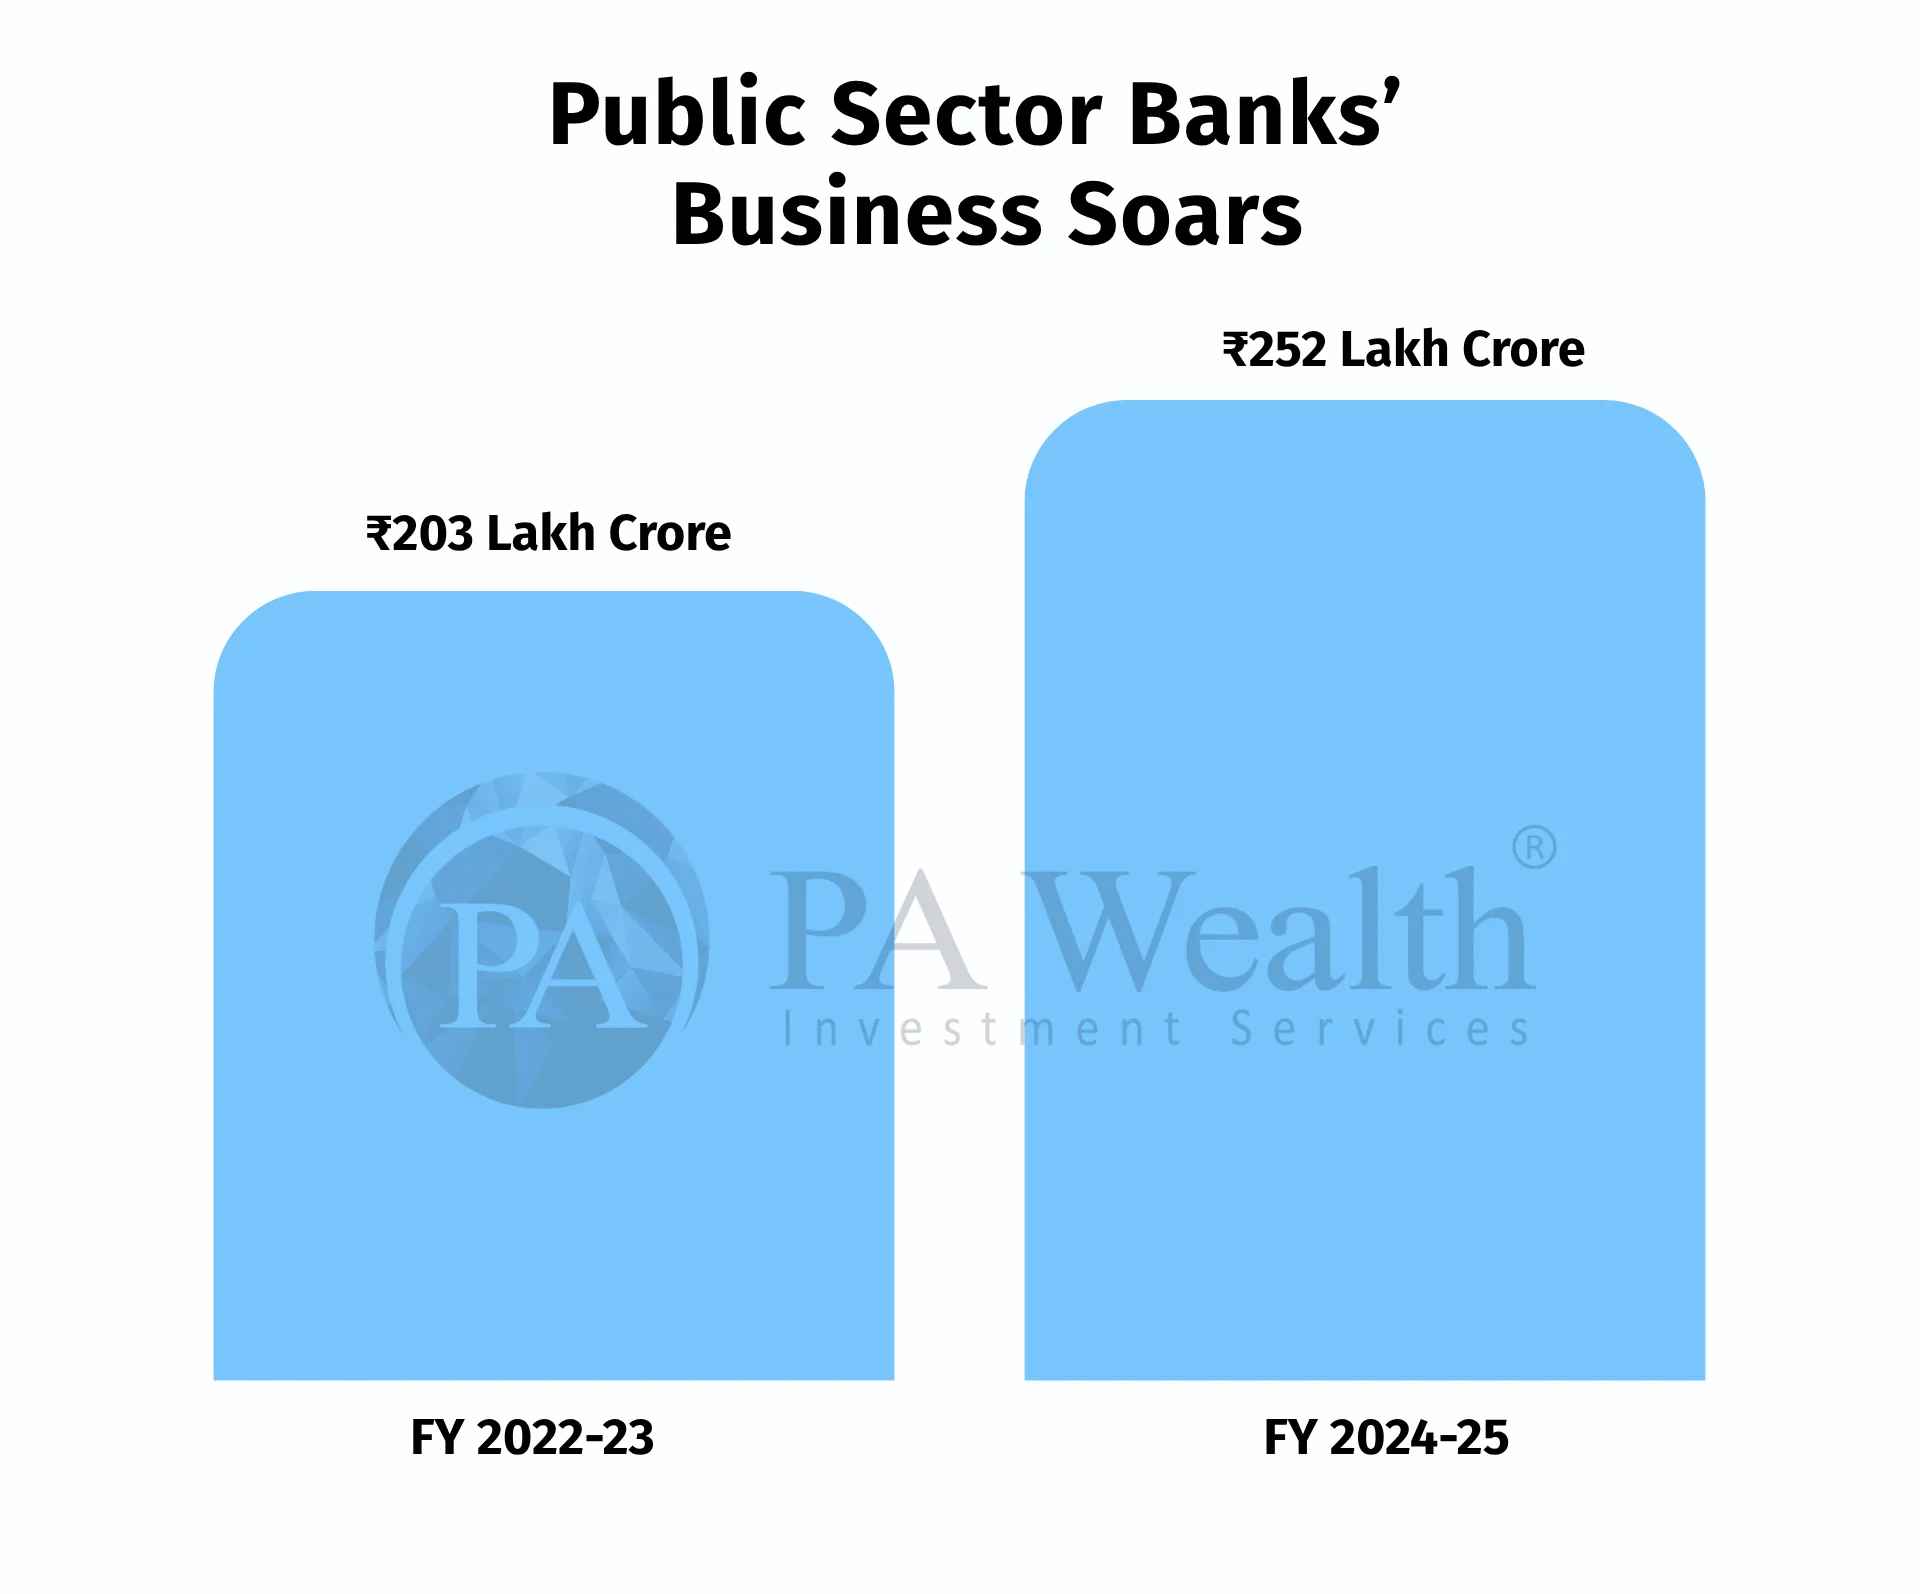
- From FY 22–23 to FY 24–25, the total Business of Public Sector Banks (PSBs) rose from ₹203 lakh crore to ₹252 lakh crore
- From FY 22–23 to FY 24–25, net profit increased from ₹1.05 lakh crore to ₹1.78 lakh crore.
- Dividend payouts grew from ₹20,964 crore to ₹34,990 crore, reflecting the continued strengthening of financial performance.
(C) Journey
(D) Board of Directors of Punjab National Bank Ltd.


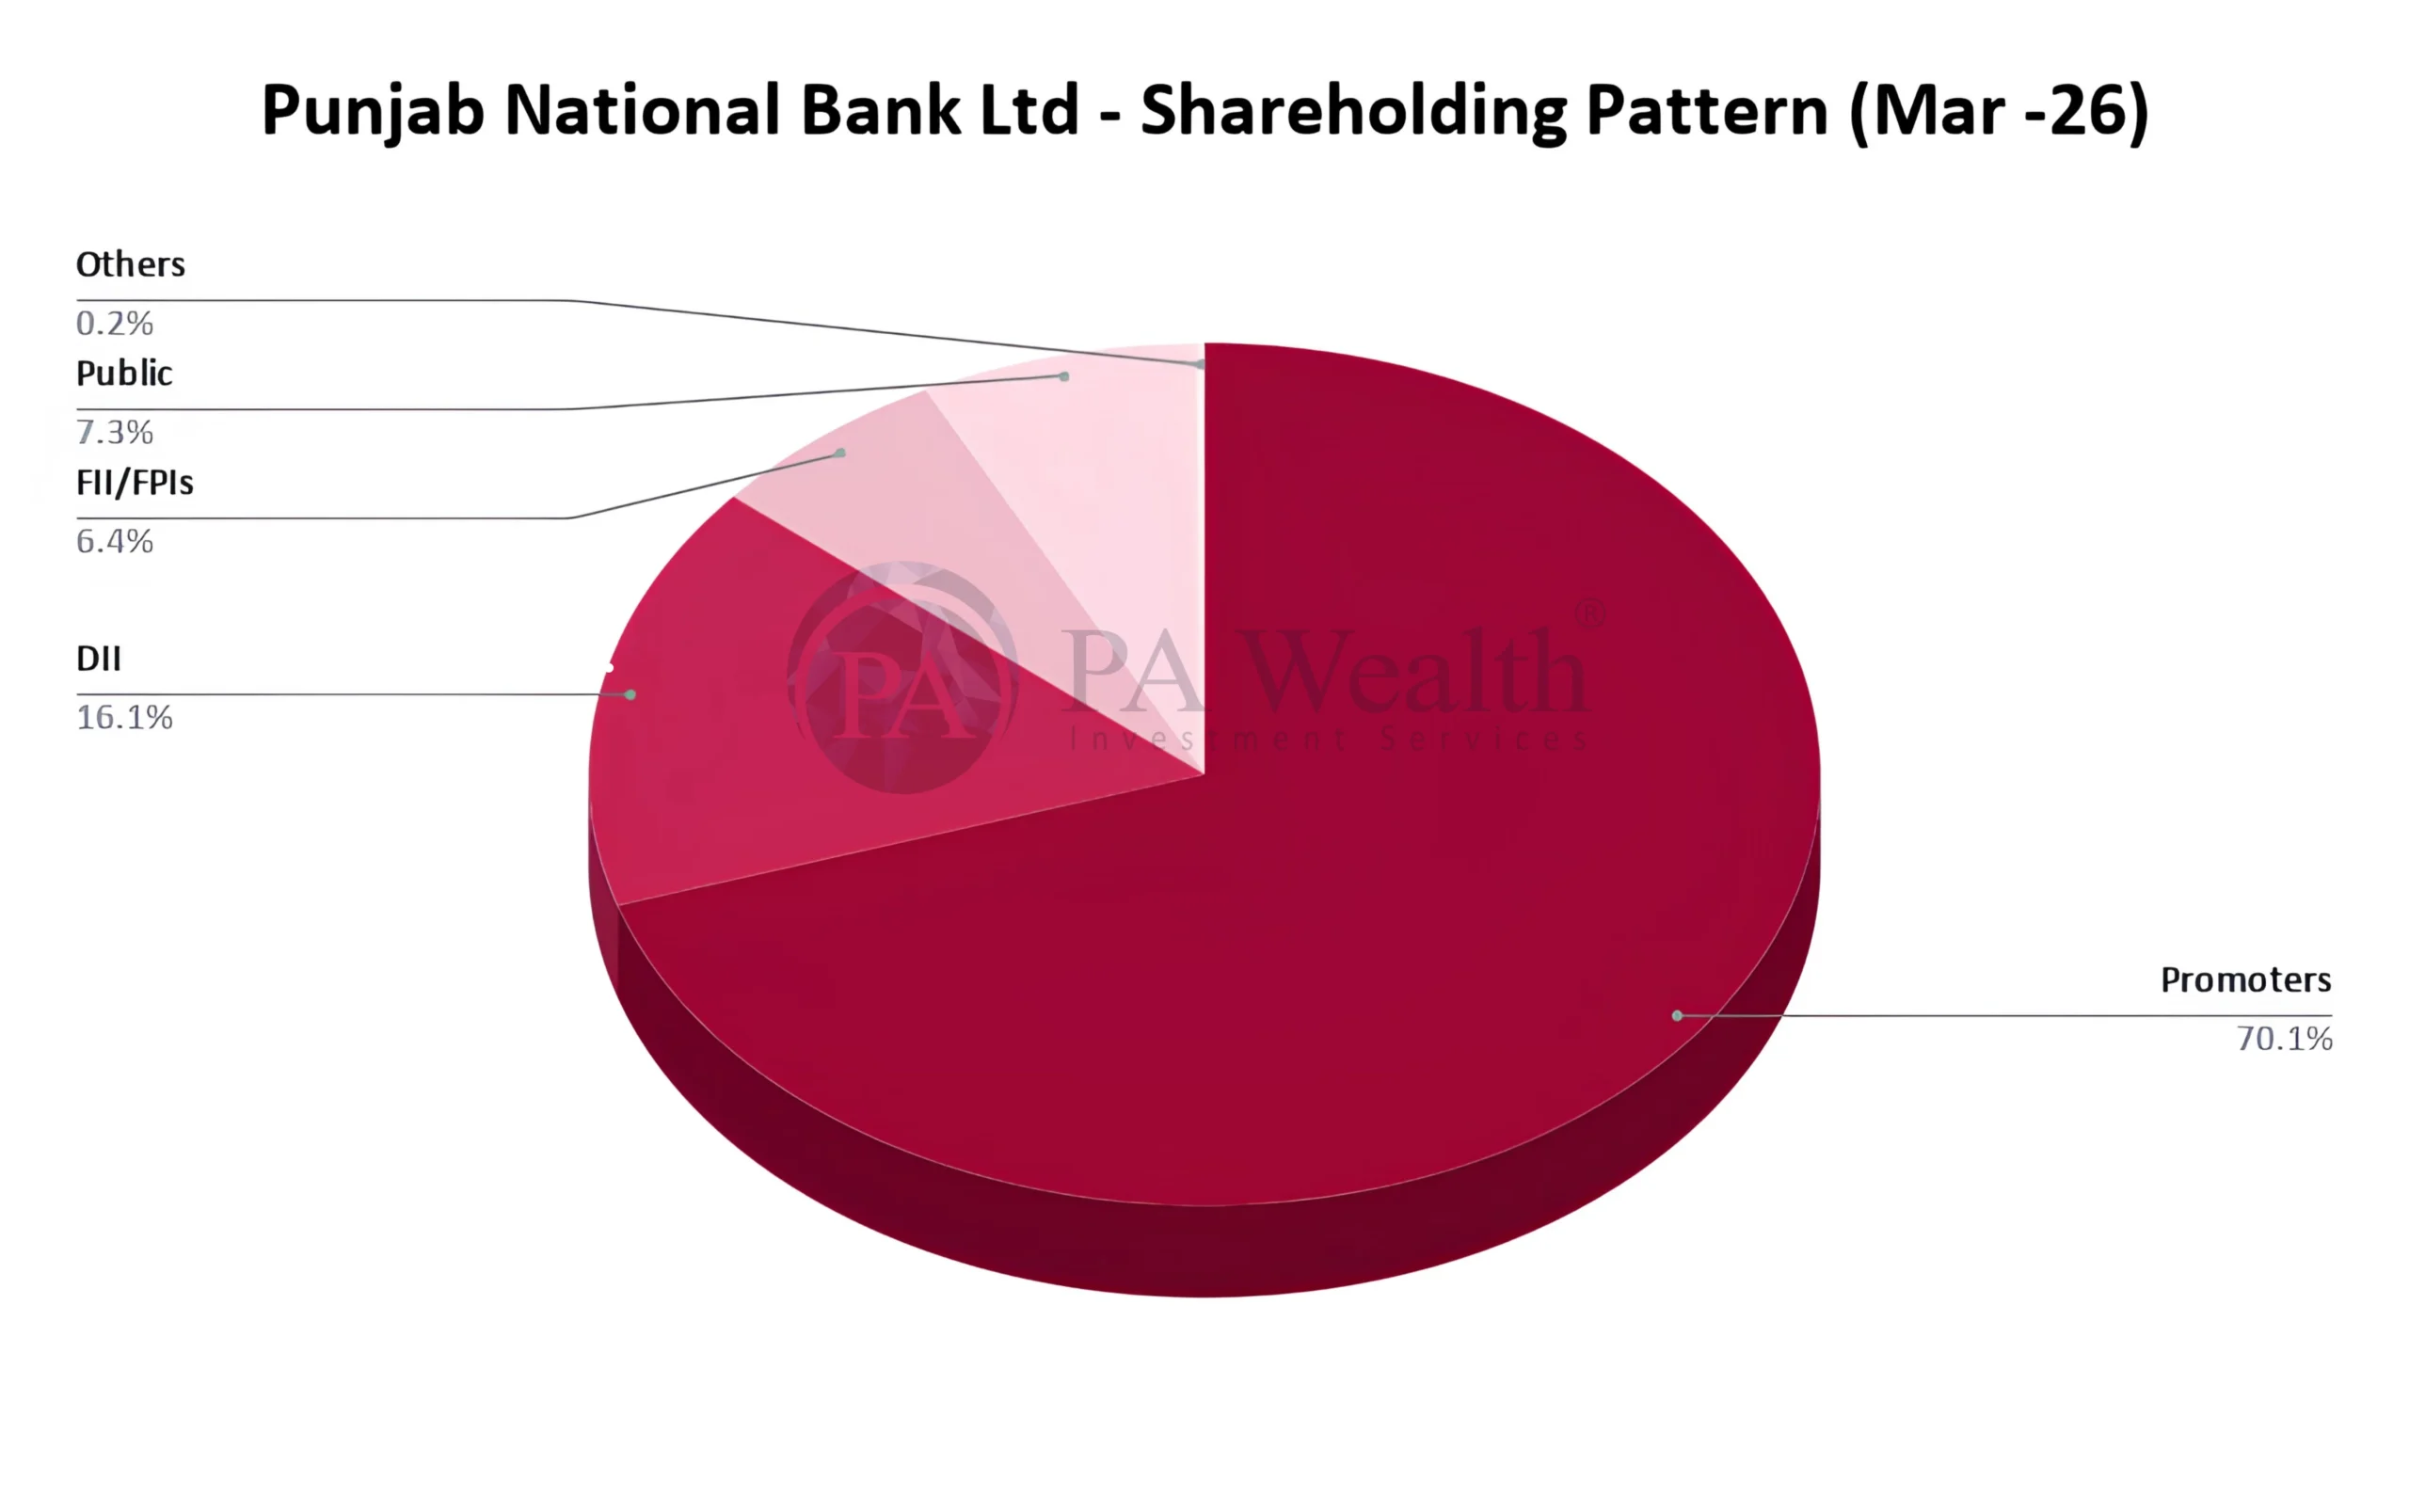
(E) Shareholding Pattern of Punjab National Bank Ltd.
(F) Business Segments of Punjab National Bank Ltd. | Stock Analysis
PNB has a well-diversified lending franchise across Retail, Agriculture, MSME and Corporate banking, with RAM (Retail, Agriculture & MSME) advances contributing 56.6% of domestic advances as of Mar’26. Total domestic advances grew 11.9% YoY to ₹11.93 lakh crore.
- Retail Banking: Retail advances stood at ₹2.81 lakh crore with strong traction in housing and vehicle loans. Retail asset quality remained healthy with GNPA at 0.73%.
- Agriculture Banking: Agriculture advances reached ₹2.0 lakh crore, supported by priority sector lending and strong gold loan growth.
- MSME Banking: MSME advances grew a robust 19.9% YoY to ₹1.95 lakh crore, aided by digital lending initiatives and government schemes.
- Corporate Banking: Corporate & other advances stood at ₹5.17 lakh crore, forming the largest share of the loan book, while maintaining low GNPA of just 0.08%.
- Overseas Business: Overseas advances grew 29.7% YoY to ₹65,609 crore, reflecting improving international business traction.
- Digital Banking: PNB continues to strengthen its digital ecosystem, with UPI transactions rising to 323 crore in Q4 FY26 and digital loan sanctions exceeding ₹20,800 crore during the quarter.
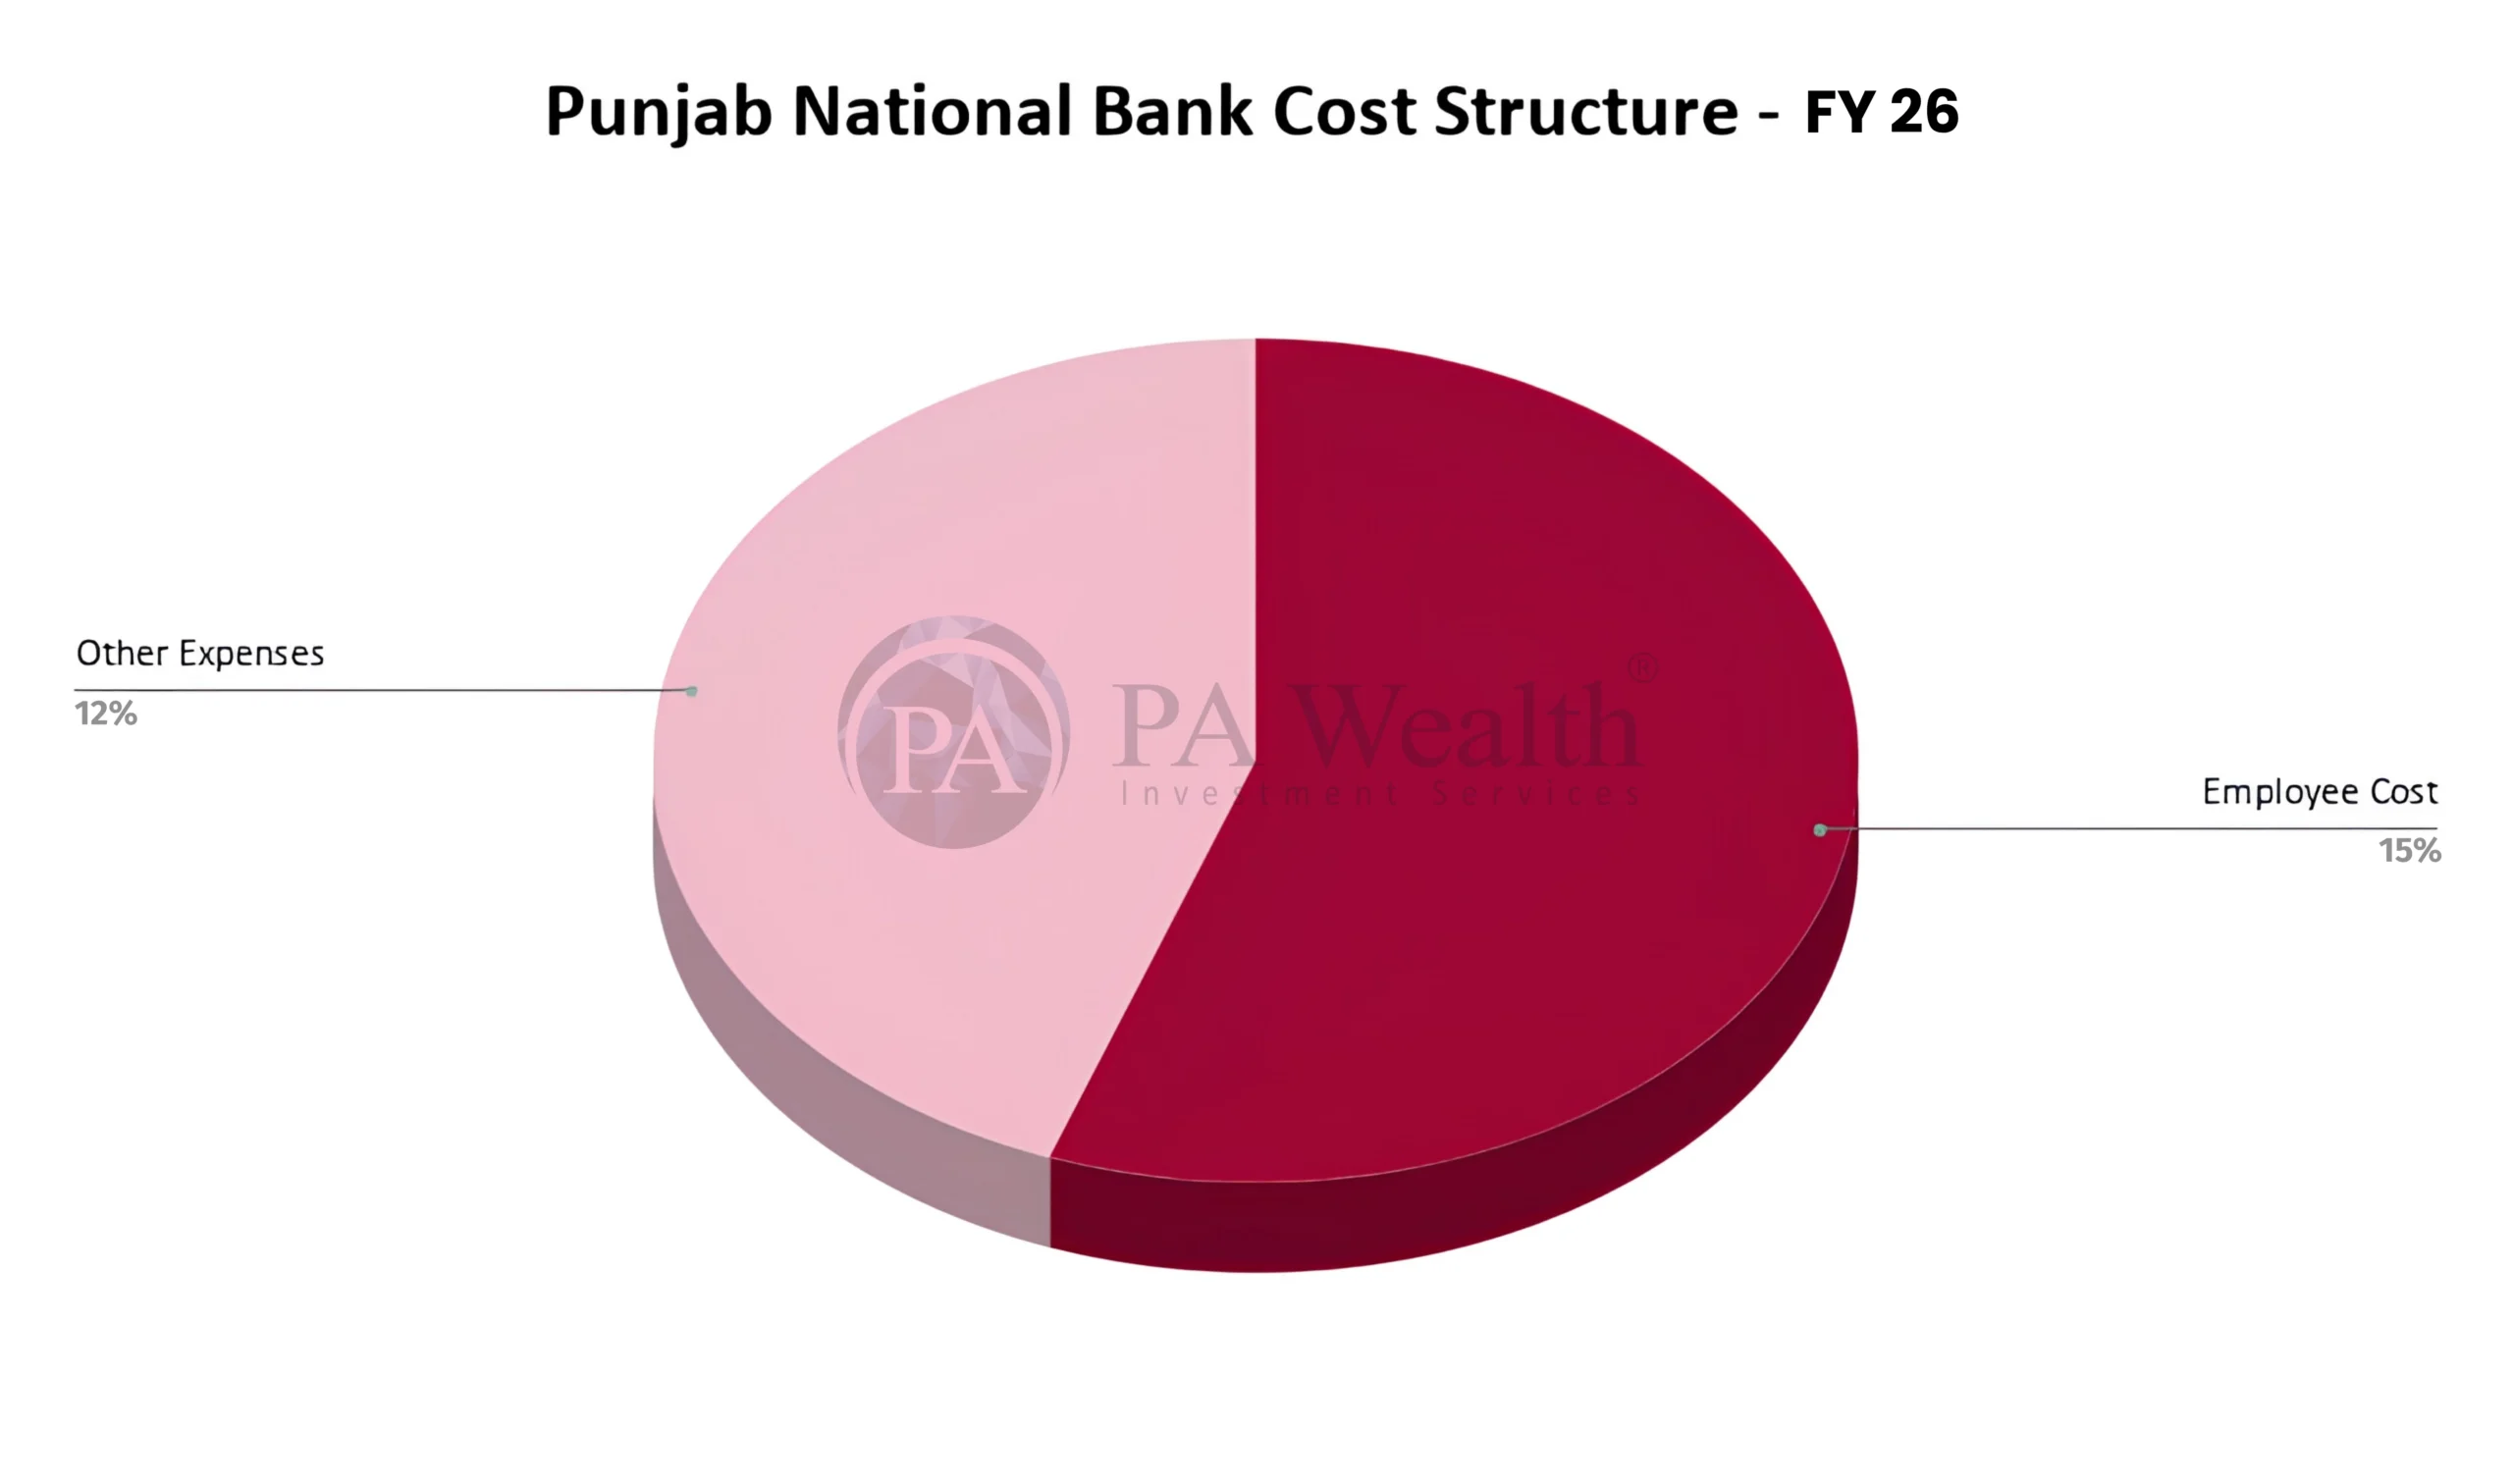
(H) Cost Structure of Punjab National Bank Ltd.
(I) Financials of Punjab National Bank Ltd.
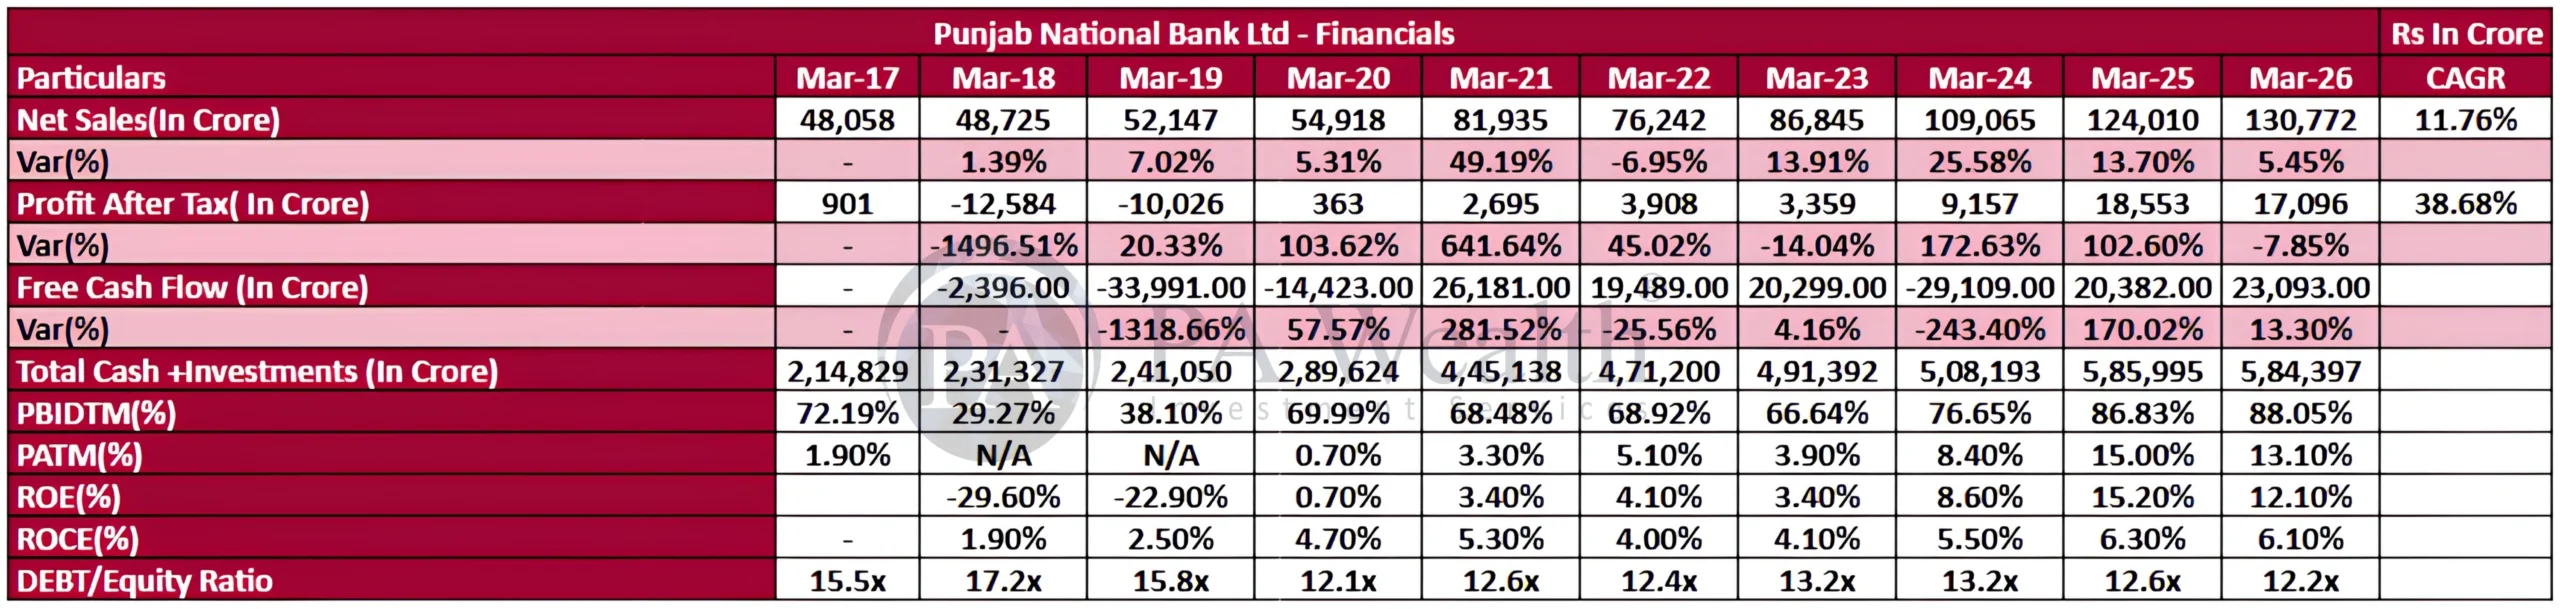

- Punjab National Bank has witnessed a strong turnaround post FY20 with sharp improvement in profitability and operational performance.
- Net Sales grew at an 11.76% CAGR from ₹48,058 Cr in FY17 to ₹1,30,772 Cr in FY26E.
- PAT recovered from heavy losses in FY18–FY19 to ₹18,553 Cr in FY25, driven by lower provisioning and improving asset quality.
- Margins improved significantly, with PAT Margin rising to 15% in FY25, reflecting better earnings quality and operating efficiency.
- ROE improved to 15.2% in FY25, indicating stronger capital productivity.
- Cash & Investments strengthened materially, supporting liquidity and balance sheet stability.
- FY26E indicates slight moderation in earnings growth after a strong recovery cycle.
- Overall, the bank has transitioned from a stressed PSU bank to a more stable and profitable franchise with improving fundamentals.
(J) Management Discussion & Concall | Stock Analysis
- PNB continued to strengthen its balance sheet with improving profitability, lower NPAs and stronger provision coverage during Q3 FY26.
- Management remains focused on granular RAM-led growth, CASA mobilization and improving operational efficiency through digital initiatives.
- Asset quality improvement remained a key focus area with analytics-driven monitoring, controlled slippages and higher recovery momentum.
- The bank is proactively preparing for future ECL norms through additional floating provisions and strengthened underwriting standards.
- Digital transformation accelerated further with revamped mobile banking, AI-led analytics and increased digital loan sourcing across segments.
- Management also emphasized customer service enhancement, branch expansion and HR transformation initiatives under Project UDAAN to support long-term growth.
Growth Oulook
Q3 FY26 Concall Highlights
- Management maintained confidence on achieving FY26 guidance across GNPA, RoA, credit cost and growth metrics.
- Additional floating provision of ₹955 crore was created proactively for future ECL implementation, taking total floating provisions to ₹1,775 crore.
- Focus remains on improving loan mix quality by reducing low-yielding corporate and IBPC exposures while scaling Retail and MSME lending.
- Retail and MSME segments continued to grow strongly at over 18% YoY.
- Management expects credit growth guidance of 11–12% and deposit growth of ~9% to be achieved by FY26-end.
- NIM remained under pressure due to faster repo-linked loan repricing, while deposit repricing benefits are expected to reflect gradually from FY27.
- Asset quality continued to improve with controlled slippages, high PCR of ~97% and recovery remaining over 2x slippages.
- Digital transformation remained a key focus area, with nearly every third RAM loan sanctioned digitally and digital transactions contributing ~95% of total transactions
(K) Strengths & Weaknesses
Strengths
- Strong sovereign backing with Government of India holding 70.08% stake as of Sep’25, supporting capital strength and balance sheet stability.
- One of India’s largest PSBs with over 13 decades of operating history and strong nationwide distribution network.
- Global business reached ₹27.87 lakh crore as of Sep’25, reflecting healthy scale and franchise strength.
- Comfortable capitalization with CRAR at 17.19% and Tier-1 ratio at 14.41%, supported by profitability and recent ₹5,000 crore QIP.
- Improving profitability and internal accruals aiding stronger net worth and capital buffers.
- Strong deposit franchise with total deposits growing 10.9% YoY to ₹16.17 lakh crore.
- Asset quality continues to improve with declining GNPA, NNPA and controlled slippages.
- High provision coverage ratio (~90% excluding TWO) provides buffer against future stress
Weaknesses
- Despite improvement, asset quality metrics remain weaker than leading large PSU peers.
- CASA growth remained relatively slower, resulting in CASA ratio declining to 37.29% from 39.31% YoY.
- Margin pressure persists due to faster repricing of repo-linked loans compared to deposits.
- Corporate loan book still carries some low-yielding exposures, impacting overall NIM profile.
- Profitability remains sensitive to credit costs and provisioning requirements under future ECL norms.
- Recovery and collection momentum needs to sustain consistently to support further reduction in NPAs.
Drop us your query at – info@pawealth.in or Visit pawealth.in
References: Annual Reports, News Publications, Investor Presentations, Corporate Announcements, Management Discussions, Analyst Meets and Management Interviews, Industry Publications.
Disclaimer: The report only represents the personal opinions and views of the author. No part of the report should be considered a recommendation for buying/selling any stock. Thus, the report & references mentioned are only for the information of the readers about the industry stated.
Most successful stock advisors in India | Ludhiana Stock Market Tips | Stock Market Experts in Ludhiana | Top stock advisors in India | Best Stock Advisors in Gurugram | Investment Consultants in Ludhiana | Top Stock Brokers in Gurugram | Best stock advisors in India | Ludhiana Stock Advisors SEBI | Stock Consultants in Ludhiana | AMFI registered distributor | Amfi registered mutual fund | Be a mutual fund distributor | Top stock advisors in India | Top stock advisory services in India | Best Stock Advisors in Bangalore