
Financial Highlights of JK Cement Ltd:
1. Profit & Loss Statement
(Click on the image to enlarge the preview). All figures in Rs. crore

2. Balance Sheet
(Click on the image to enlarge the preview). All figures in Rs. crore

3. Cash Flow Analysis
Strong income from operations denotes longevity.
(Click on the image to enlarge the preview)

4. Earning Quality – Net Profit vs Operating Cash
(Click on the image to enlarge the preview).

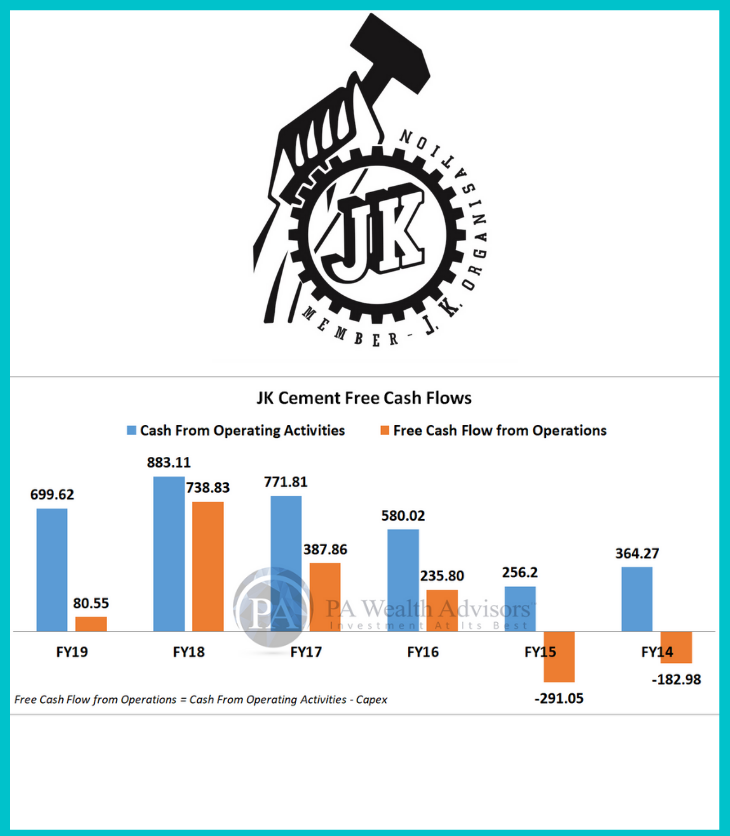
5. Free Cash Flow from Operations
(Click on the image to enlarge the preview)

6. Performance Ratios
| JK Cement – Performance Ratios | FY19 | FY18 | FY17 | FY16 | FY15 | FY14 |
| ROA (%) | 3.75 | 4.41 | 2.73 | 0.90 | 2.40 | 1.53 |
| ROE (%) | 11.29 | 15.50 | 10.43 | 3.42 | 9.02 | 5.01 |
| ROCE (%) | 12.73 | 13.42 | 11.84 | 8.17 | 8.15 | 7.46 |
| Debtors Turnover(x) | 21.19 | 22.94 | 22.52 | 22.49 | 27.22 | 28.34 |
7. Efficiency Ratios
| JK Cement – Efficiency Ratios | FY19 | FY18 | FY17 | FY16 | FY15 | FY14 |
| Receivable Days | 17.23 | 15.91 | 16.21 | 16.23 | 13.41 | 12.88 |
| Inventory Days | 42.56 | 41.83 | 41.33 | 43.22 | 50.31 | 56.94 |
| Payable Days | 57.29 | 48.83 | 39.53 | 28.56 | 37.51 | 40.15 |
8. Growth Ratios
| JK Cement- Growth Ratios | FY19 | FY18 | FY17 | FY16 | FY15 | FY14 |
| Net Sales Growth(%) | 8.35 | 20.69 | 6.23 | 11.10 | 21.87 | -3.99 |
| Core EBITDA Growth(%) | -0.08 | 11.04 | 38.35 | 18.69 | 25.22 | -33.84 |
| EBIT Growth(%) | 0.94 | 13.43 | 47.60 | 6.78 | 39.90 | -44.11 |
| PAT Growth(%) | -7.69 | 66.07 | 213.61 | -61.36 | 89.36 | -67.48 |
| Adj. EPS Growth(%) | -17.61 | 62.92 | 207.22 | -59.72 | 86.18 | -66.57 |
9. Valuation
| JK Cement – Valuation Ratios | FY19 | FY18 | FY17 | FY16 | FY15 | FY14 |
| Trailing PE – Dec 19 | 18.37 | |||||
| Price / Book Value(x) | 2.47 | 3.60 | 3.82 | 2.96 | 2.89 | 1.10 |
| Dividend Yield(%) | 1.16 | 0.98 | 0.86 | 0.60 | 0.60 | 1.25 |
| EV/Net Sales(x) | 1.73 | 1.95 | 2.34 | 2.02 | 2.20 | 1.45 |
| EV/EBITDA(x) | 9.96 | 10.35 | 11.43 | 12.83 | 14.90 | 10.11 |
| EV/EBIT(x) | 13.53 | 14.20 | 16.02 | 19.18 | 20.04 | 15.20 |
10. Quarter Performance
(Click on the image to enlarge the preview)


To know about our investment advisory services and to place your enquiries: Drop us a mail at – info@pawealth.in or Visit pawealth.in
Disclaimer: The report only represents personal opinions and views of the author. No part of the report should be considered as recommendation for buying/selling any stock. The report & references mentioned are only for the information of the readers about the industry/company stated.

Comparative view of financial analysis is quite useful
Thanks. Shall share more informative analysis. Keep reading & sharing our blog posts.