

When the industry headline says assets under management fell by more than ₹4 lakh crore in a single month, it is natural to assume investors are heading for the exits. September 2026 shows why that reading can be badly wrong.
Total mutual fund AUM dropped 5.1% to ₹82.64 lakh crore, yet monthly SIP contributions touched an all-time high of ₹32,490 crore and net equity inflows jumped 31%. The gap between those numbers is the real story, and it says a lot about how Indian investors are behaving right now.
Record SIPs: A Habit, Not a Trend
According to AMFI data released on 12 October 2026, SIP contributions reached ₹32,490 crore in September, up from ₹32,297 crore in August. That is about 11% higher than the ₹29,361 crore recorded in September 2025. SIP contributions first crossed the ₹32,000 crore mark only in August 2026, so the record is being extended month after month rather than set once. Around 63 lakh new SIPs were registered during the month.
| Metric | Value |
|---|---|
| SIP contribution, September 2026 | ₹32,490 crore (all-time high) |
| SIP contribution, August 2026 | ₹32,297 crore |
| SIP contribution, September 2025 | ₹29,361 crore |
| SIP assets under management, end September 2026 | ₹17.86 lakh crore |
| New SIPs registered in September 2026 | About 63 lakh |
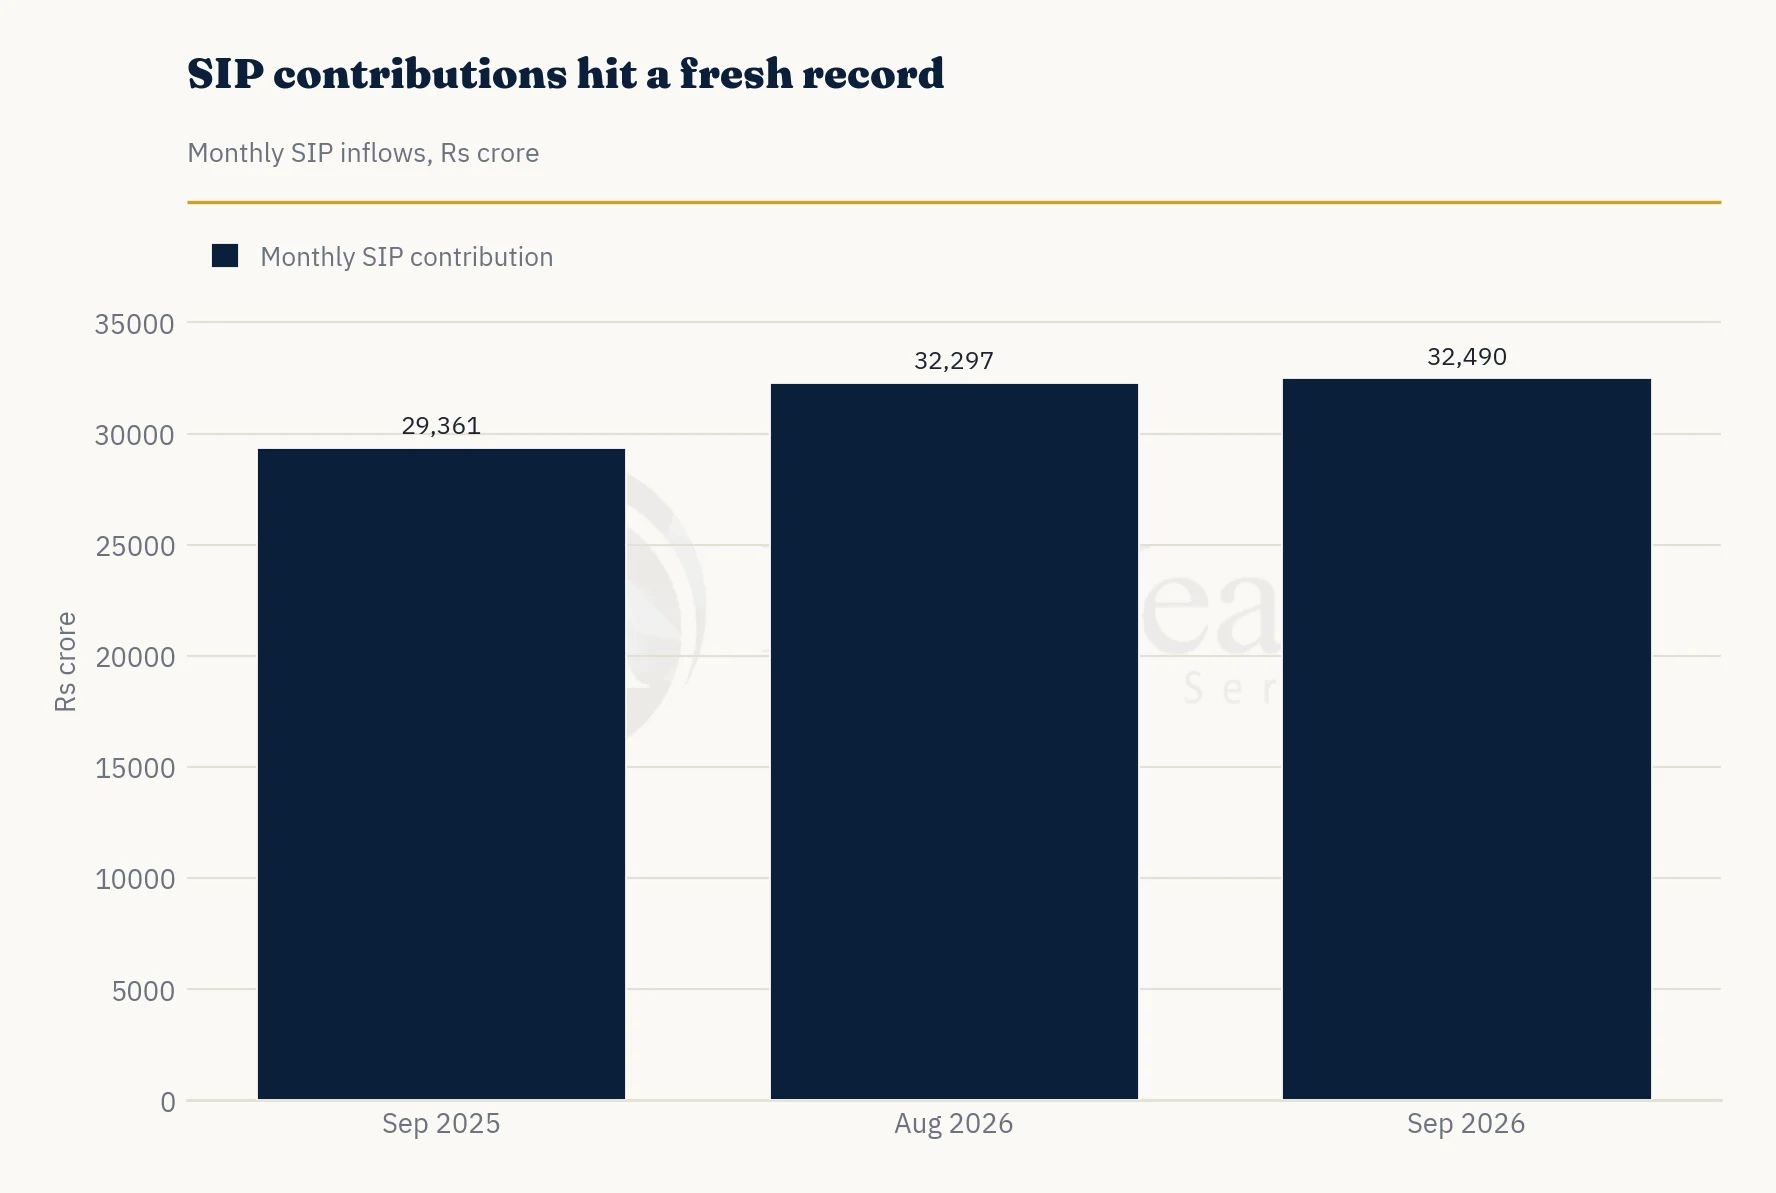
The Core Rule: A SIP is a commitment to a process, not a bet on a month. The strongest evidence of that is that contributions kept rising in a month when the headline AUM number fell.
Why Did AUM Fall 5.1% Despite Record SIPs?
Total industry AUM fell from ₹87.08 lakh crore at the end of August to ₹82.64 lakh crore at the end of September, a drop of roughly ₹4.44 lakh crore. The cause sits in debt funds, not equity. Debt schemes recorded net outflows of about ₹1.83 lakh crore in September, compared with about ₹8,127 crore in August.
The largest outflows came from the short-duration categories that corporate treasuries use to park surplus cash.
| Debt category | September 2026 net outflow |
|---|---|
| Liquid funds | ₹95,743 crore |
| Money market funds | ₹50,846 crore |
| Ultra-short duration funds | ₹11,729 crore |
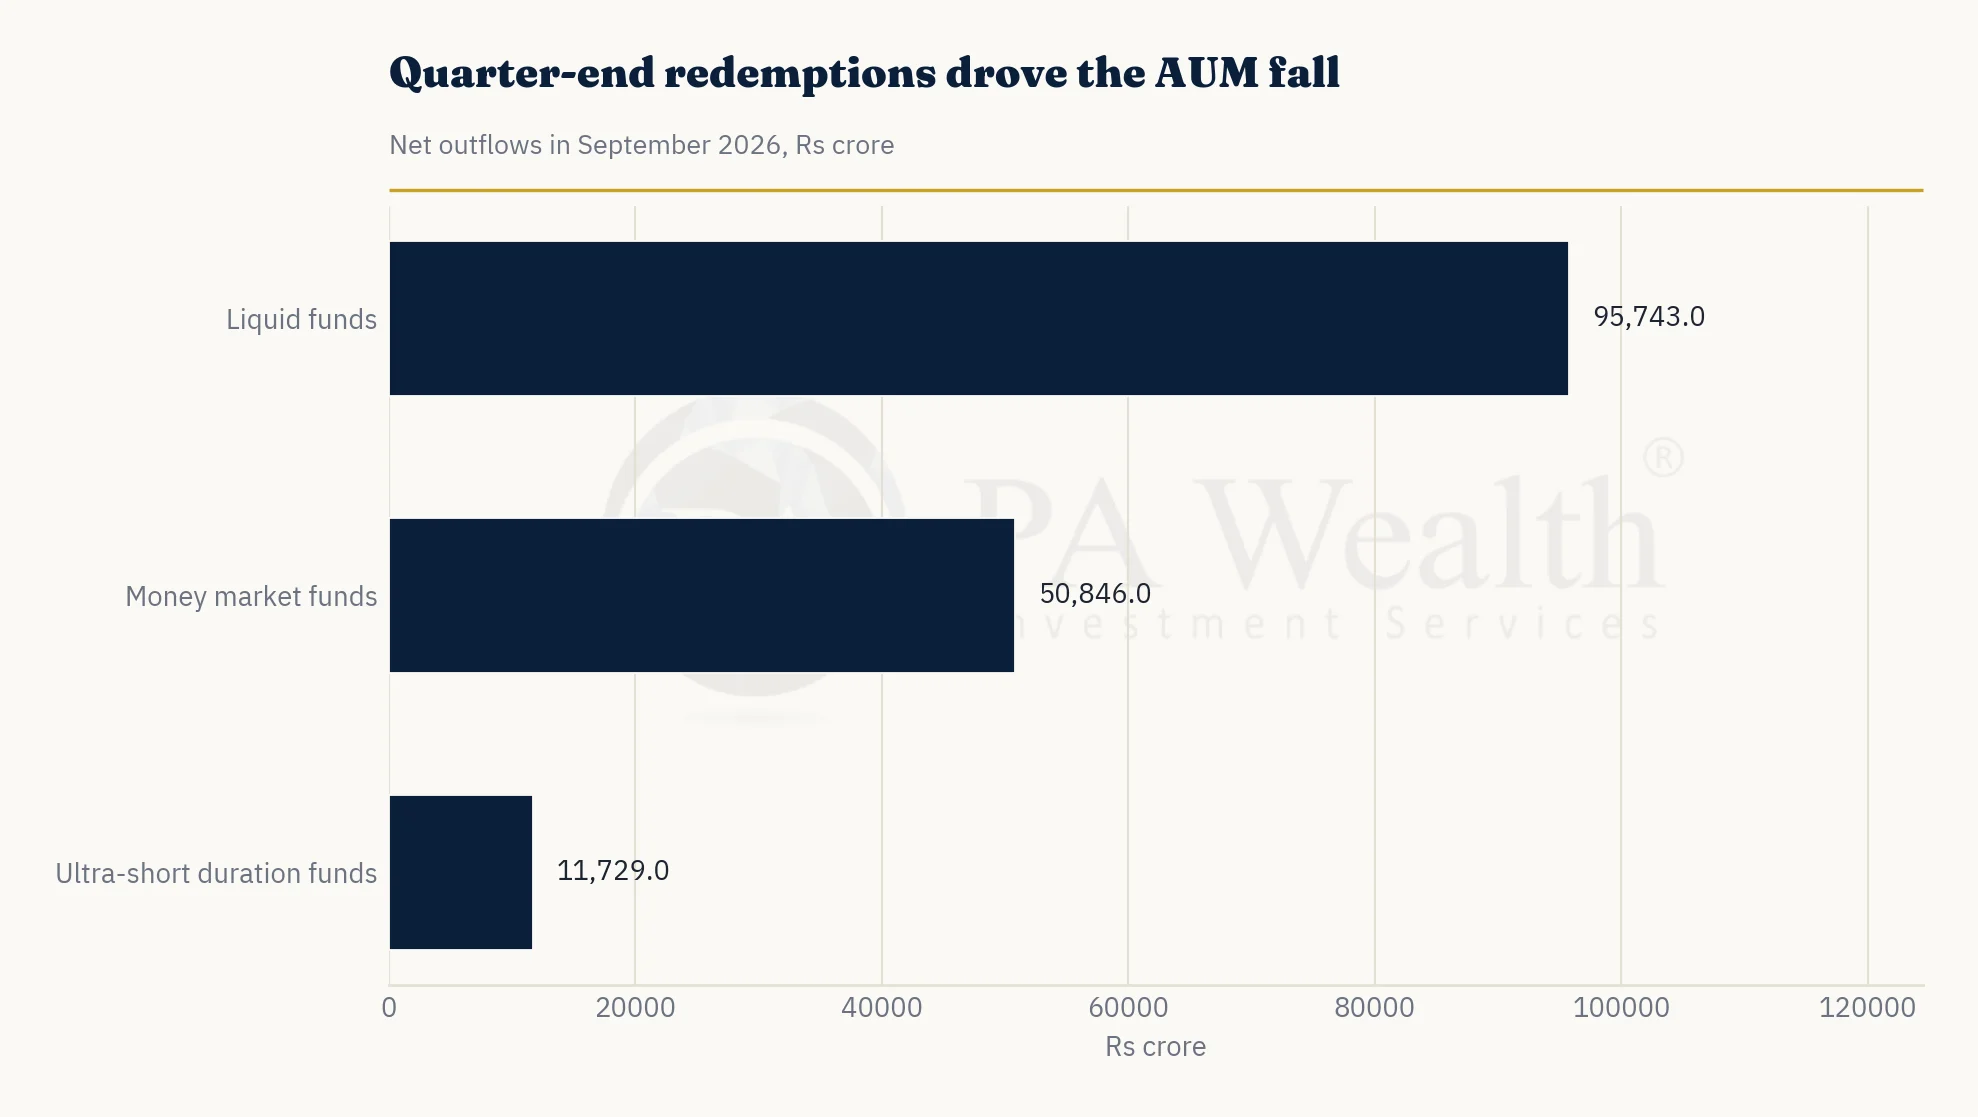
Quarter-end liquidity: Corporates routinely withdraw from liquid and short-term debt products at quarter-end to meet advance tax payments and working capital needs. A similar pattern was visible in March 2026. Overall, the industry recorded a net outflow of about ₹1.33 lakh crore in September, and the fall in AUM reflects this treasury activity far more than a change in retail investor behaviour.
It is also worth remembering that AUM moves with market prices as well as flows. A weaker equity market in a given month lowers the reported value of assets already invested, even when new money keeps coming in.
Where the Equity Money Is Going
Net inflows into equity schemes rose about 31% month-on-month to ₹38,307 crore in September, from ₹29,329 crore in August. Open-ended equity schemes mobilised ₹74,832 crore during the month against redemptions of ₹36,525 crore. Eleven of the thirteen equity categories saw net inflows.
| Category | August 2026 (₹ crore) | September 2026 (₹ crore) |
|---|---|---|
| Small cap | 7,973 | 9,039 |
| Mid cap | 6,989 | 7,835 |
| Flexi cap | 5,059 | 6,702 |
| Large and mid cap | 3,873 | 4,271 |
| Multi cap | Not compared | 3,860 |
| Large cap | Net outflow | 859 |
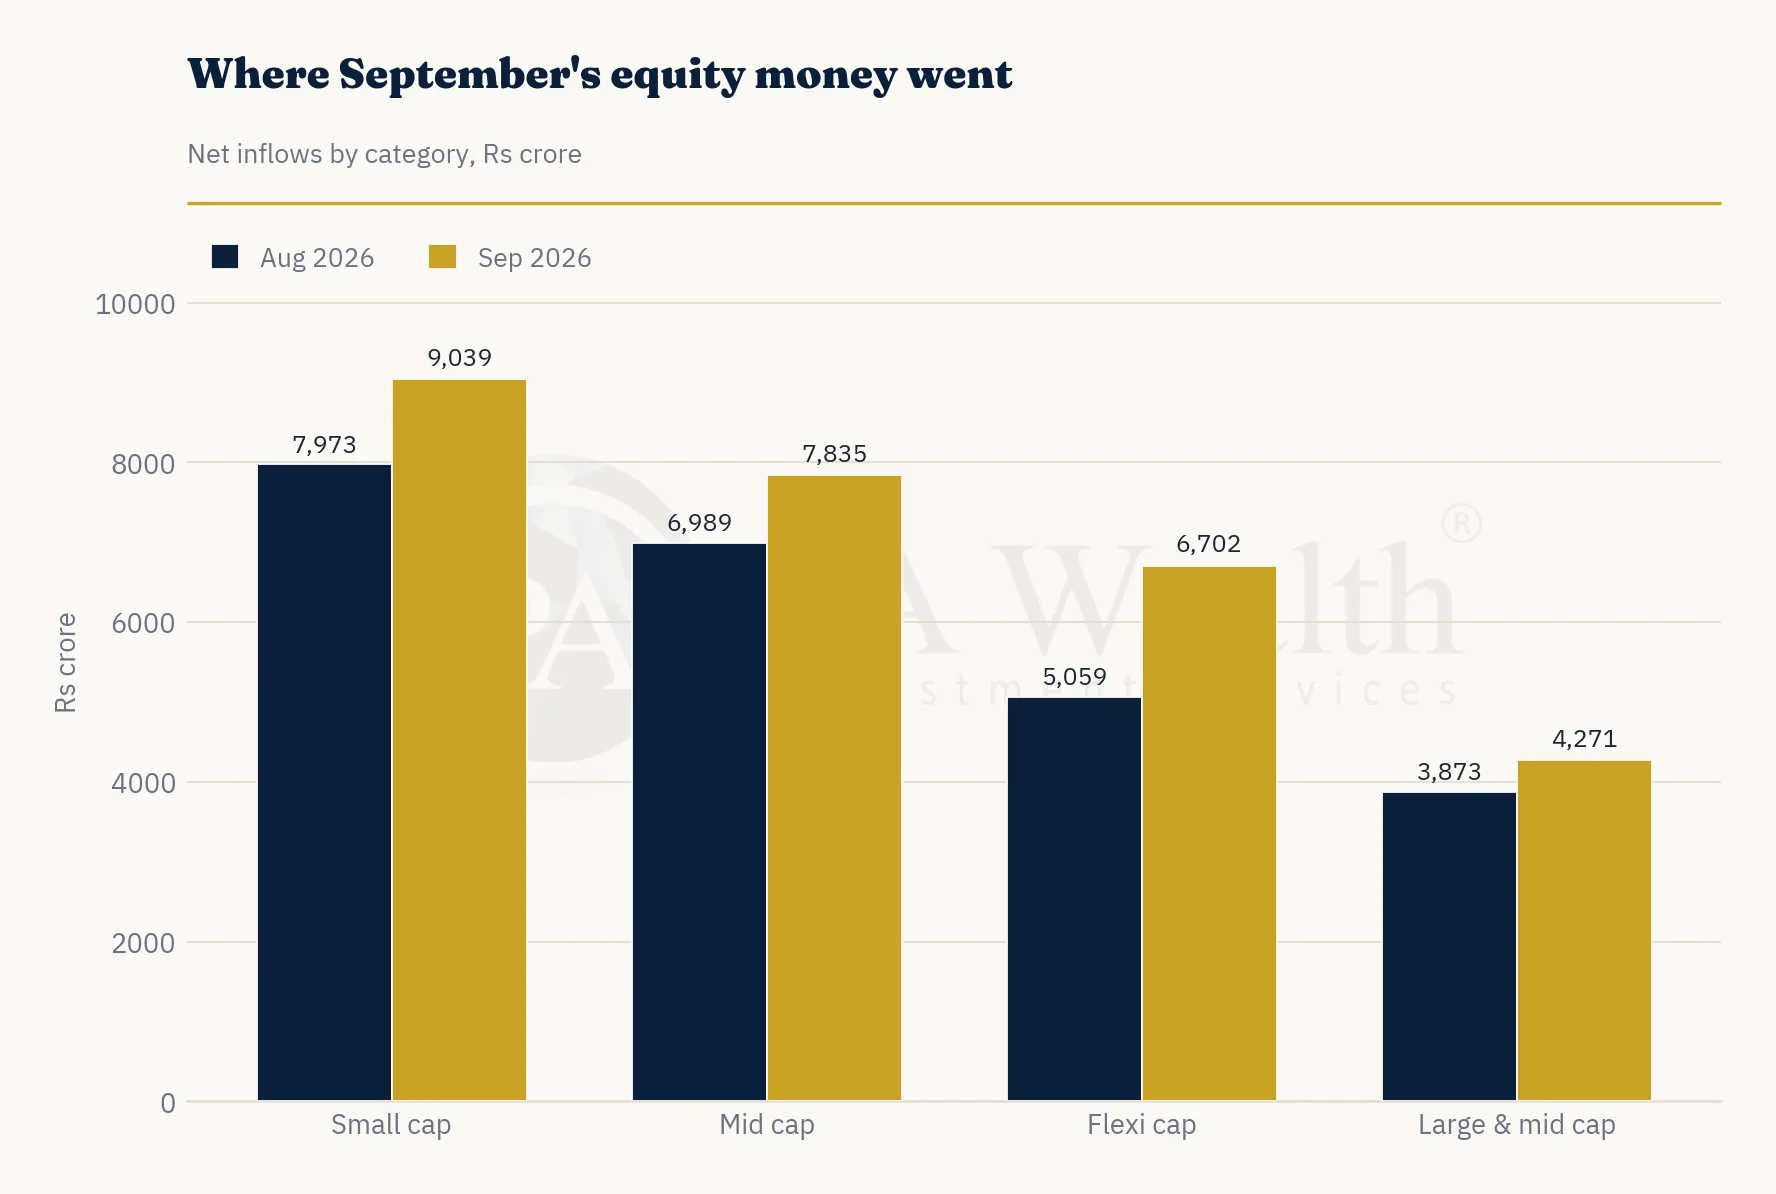
Small cap funds led all categories, and together with mid cap funds they drew about ₹16,874 crore, or roughly 44% of all equity inflows. Small cap schemes alone took in about 24% of the total. Large cap funds returned to positive territory with ₹859 crore after modest outflows in August.
Beyond Equity: Hybrid, ETFs and Gold
Not every pocket of the industry moved the same way. Hybrid schemes recorded a marginal net outflow of about ₹457 crore, even as multi-asset allocation funds attracted about ₹3,667 crore and aggressive hybrid funds about ₹1,864 crore. Part of the hybrid outflow reflects arbitrage funds, which also see quarter-end treasury withdrawals.
Passive and commodity products kept attracting money. Equity ETFs received about ₹9,960 crore, gold ETFs ₹4,451 crore (up from ₹2,597 crore in August) and silver ETFs ₹1,974 crore. Specialised Investment Funds also continued to gain traction.
Definition – Specialised Investment Funds (SIFs): A SEBI-regulated category that sits between mutual funds and PMS, allowing more flexible strategies for investors who meet a higher minimum investment threshold.
The Concentration Question
The tilt towards smaller companies reflects genuine growth appetite across the investor base. It also has a consequence that is easy to overlook. When an investor follows momentum year after year, a portfolio that began as a balanced mix can drift into a heavy small and mid cap allocation without any single decision being made to do so.
Definition – Allocation drift: The gradual change in a portfolio’s asset or category mix caused by uneven returns and uneven new contributions, rather than by a deliberate choice.
Small cap funds are also the category most prone to sharp swings during market corrections. News reports on the September data noted that small cap flows continued despite broader market weakness, which is exactly the kind of behaviour that deserves a periodic check against an investor’s risk profile.
The Core Rule: Participation and portfolio construction are two different disciplines. The habit of investing is the first. Deciding where each rupee lands is the second.
A Note on Reading SIP Numbers
The ₹32,490 crore figure is the gross amount contributed through SIPs in a month. It does not net out SIPs that are stopped or paused. SEBI data cited in the press shows that net SIP inflows were around ₹2 trillion in FY26, about 56% of roughly ₹3.5 trillion in gross SIP investments, the highest share in at least three years, while SIP account closures also rose in a volatile market. Record contributions are a strong signal of habit, but they are not the same as every SIP running uninterrupted for years.
Total mutual fund folios also stood at about 28.35 crore at the end of August 2026, against 25.19 crore a year earlier, so participation continues to widen.
The Bottom Line
September 2026 gave two very different headlines from the same dataset. The falling AUM was largely a quarter-end treasury event in liquid and short-term debt funds, and it should not be read as a loss of faith by long-term investors. The record SIP number and the 31% jump in equity inflows point the other way: investors are continuing to invest through weak markets.
The natural follow-up to strong discipline is a review of where that discipline is landing. Check which categories your monthly contributions go to, how much of your portfolio now sits in small and mid cap funds, and whether that still matches your goals and your tolerance for volatility.
FAQs
Why did mutual fund AUM fall in September 2026 if SIPs hit a record?
SIP contributions are only a part of total industry assets. In September, debt funds saw net outflows of about ₹1.83 lakh crore, led by liquid, money market and ultra-short funds, as corporates withdrew cash for quarter-end advance tax and working capital needs. That single movement was far larger than the ₹32,490 crore of SIP money, so total AUM fell 5.1% even though SIP and equity flows were strong.
Is the fall in AUM a sign that investors are losing confidence in mutual funds?
The data does not suggest that. Net equity inflows rose 31% to ₹38,307 crore, SIP contributions reached a new high, and eleven of thirteen equity categories saw inflows. The outflows were concentrated in short-term debt categories that are mainly used by corporate treasuries. The same quarter-end pattern was seen in March 2026, which points to a seasonal cash-management effect rather than structural investor distress.
Should I move my SIPs into small cap funds because they received the most inflows?
Inflows show what other investors are doing, not what suits your portfolio. Small cap funds can fall sharply in corrections, and heavy inflows often follow strong recent performance. A more useful approach is to review how much of your existing portfolio is already in small and mid cap funds and whether that fits your goals, time horizon and risk tolerance. Your relationship manager or advisor can help with that review.
What does a record SIP number actually mean?
It means gross monthly contributions through SIPs reached their highest level so far, at ₹32,490 crore. It reflects strong investing discipline across the country, with about 63 lakh new SIPs registered in September alone. It does not tell you how many existing SIPs were stopped during the month, or how the money is spread across categories, which is why periodic portfolio reviews matter alongside the habit of investing.
Disclaimer: This article is for information and education only and is not investment advice or a recommendation to buy, sell or hold any security or scheme. Data is sourced from AMFI and media reports of AMFI and SEBI releases and may be revised. Mutual fund investments are subject to market risks. Please read all scheme related documents carefully before investing. Past performance is not indicative of future returns. Please consult your financial advisor before making any investment decision.