
Voltas Ltd.
Voltas Ltd. was established in the year 1954 as a collaboration between Tata Sons & Volkart Brothers. The company is currently chaired by Mr. Noel N. Tata and managed by Mr Pradeep Bakshi.
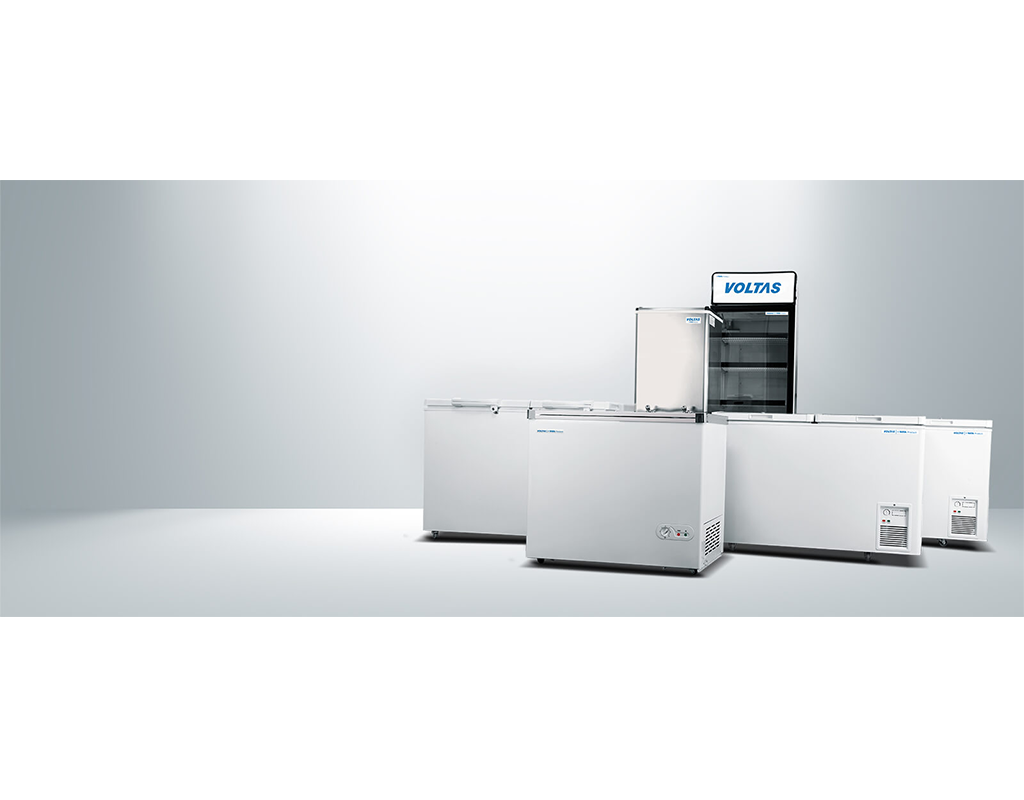
The company is a household name through its Unitary product business that manufactures products in the category of Air conditioners, Air coolers, Commercial Refrigerators, Water Treatment R.O’s, Water Coolers & Water Dispensers. The other products involve Mining & Construction Equipment & Textile Machineries. The company is considered as a Market leader in the Room AC market in India.
The other division of the business is involved in the Projects business. This involves both Domestic & International Projects in Electro Mechanical segments, Electricity Distribution etc.
Blue Star Ltd.
Blue Star Ltd. was founded in the year 1943 by Mr Mohan T. Advani, and today it is the largest Central Air conditioning company in India. The company is managed by the Advani (promoter) family. The company has 2 operating segments of ‘Electro Mechanical Projects & Packaged Air Conditioning System’, and, ‘Unitary Products’ segment. The company transferred its 3rd segment of ‘Professional Electronics & Industrial Services’ to its wholly owned subsidiary.
Blue Star is also the largest Air Conditioning & Commercial refrigeration – after Sales Service provider. Owing to this capability, Blue star ventured into Water purifier business, which requires regular after sales service.
In the recent years, there have been few changes in the management. With the retirement of Mr Satish Jamdar from the position of Managing Director, Mr. Vir S. Advani & Mr. B. Thiagarajan took the place as Joint MD. Further, Suneel M. Advani took charge as the Chairman after the retirement of his elder brother, Mr Ashok M Advani.
Comparative Points
Shareholding Pattern
In Voltas Ltd., the promoters are holding ~30% of the entire shareholding, while the Institutional holding is ~48% & Non Institutional holding is ~22% (as on Dec 31, 2018). Whereas, in Blue Star Ltd, promoters are holding ~39% and the rest is controlled by both the Institutions & Non Institutions with ~31% of the shares each. Amongst the promoters, Vistara ITCL is holding ~20% shares ( ITCL, was formerly the ILFS Trust Company Ltd, which was took over by Vistara, a foreign Company)

Shareholders holding more than 1% of the capital

Segments


December 2018 Quarter Review


Manufacturing Facilities
Voltas has currently 3 manufacturing facilities. The company has recently announced its Tirupati facility, while the Sanand facility shall be used to manufacture Voltas Beko products, which are presently being sourced from China, Thailand & Turkey; except for the Twin Tub washing machine that are sourced from domestic OEM’s. The facility is expected to be ready by Mid 2019.
Blue Star had earlier announced its plans to launch 2 additional facilities in Jammu & Sri city (Andhra Pradesh), but owing to infeasibility Jammu facility plan was cancelled.

Upcoming Facilities

Market Share
Voltas is the market leader in the room AC business, and has been able to maintain its leadership since 2012. More so the company is the III largest player in the Air Cooler category. The company’s market share in room AC as at end of March 2018 was around 22.1% (as per the secondary sales volume); the company reported an increased market share to 24% in the 2nd Quarter of financial year 2019. Apart from this, the company enjoys a dominant market share in its Commercial refrigeration & water cooler business.
On the other hand, Blue Star is a more premium player, it is the market leader in the Ducted AC system with 35% market share. In the Variable Refrigerant Flow (VRF) category the company has a market share of 16%, and the company is aiming to increase this to 20%. Further, in the Chiller category, Bluestar has 14% market share and in order to become the 2nd largest player in the category it is focussing at 20% share of the market. In the room AC market, the company has about 12.8% market share currently, while at the end of March 2018, it was around 11%. In its newly launched Water Purifier segment, Blue Star had ~1% share at the end of March, 2018, which it increased to ~2.5% by Dec 2018.
Distribution Network
Voltas being the market leader, leads in the number of retail touch points for the company, and has a more diversified retail network with about 100 exclusive Voltas stores. Owing to this, the company has plans to use 85% of its touchpoints for the purpose of launching Voltas Beko products.

Sales
The Net Sales of Voltas are 1.35 times the sales of Blue Star as on 31 March, 2018. The sales of Voltas have grown at a CAGR of 3% in the past 5 years, while that of Blue Star has grown at around 10% CAGR.
But if we consider the previous 3 year CAGR performance, then Voltas Grew at ~7% and Blue Star grew at ~14%. Blue Star’s 50% of the sales is from South India, followed by both North & West India at the same levels & at last by the Eastern region. Following is the chart of the Net Sales of both the companies (Rs cr.):

EBITDA Margins
In the earlier years the margins were in single digits, Voltas has improved the same to early double digits in FY 18, while Blue star is still generating single digit margins.

PAT Margins
The PAT margins of companies have had remained in the single digits, while blue star remains on the lower single digits, the PAT margins of Voltas are better in comparison.

Segment Revenue
In Blue Star Ltd., segment 1 that is largely based on projects & commercial Air conditioning business contributes the maximum to the Revenue, followed by segment 2 that is engaged in manufacturing of Unitary products , followed by the 3rd segment of Professional Electronics.
On the other hand, in Voltas, segment 1 involved in the project & air conditioning business contributes around 45% towards the total turnover , while the major chunk comes from segment 2 involved in the Unitary products, lastly 5% of the turnover is from Engineering products & services. Voltas’s primary reason for huge revenue from Segment 2 is its strong presence in the Top 8 Metro cities of India, which contribute around 68% of its sales.
In order to improve their respective performances in the Projects segment, both companies have decided on to be selective on projects as well as in choosing the sites, so as to not to erode the margins.

Segment wise Contribution to Results
In Blue Star, while segment 1 contributes around 51% of revenue its share in results is just 39%, while segment 2 leads with 55% contribution to the Results, lastly the 3rd segment that contributes nearly 6%.
In the case of Voltas also, the Unitary products contribute the maximum towards results, followed by Projects segment & lastly by the Engineered products & services segment.
In segment 1, Voltas maintains margin guidance of around 7-8%, while, Blue Star guidance around 5-6%.
In segment 2, Voltas targets around 12-13% margin while Blue Star operates within a range of 9- 9.5% margin in the same category, before adjusting the loss of about 150 bps on the Water purifier segment.

Research and Development
The companies need to engage in regular & extensive research & designing work in order to bring a breakthrough improvement in technology & innovation, which in turn, can grant them competitive edge in terms of their competitors & help secure a considerable chunk of the total market.
While, Voltas has maintained their R&D expense at 0.1% of their total turnover, Blue Star has over the years has spent on an average 1.2% of their turnover on R&D.

Advertisement Expenditure
Blue Star has over the years increased its expenditure on Advertisement, at present it is spends ~3% of its total turnover on maintaining & improving its brand recall. While on the other hand, Voltas’s expenditure on Advertisement is quite less and is around 1% of the total turnover.

Forex
Overall the foreign exchange used always exceeds the foreign exchange earned for both the companies. This is essentially because the firms have investments in their Joint ventures, use imported raw material in the form of Compressors, Indoor Unit (IDU) of AC, Ferrous & non-ferrous commodities etc.
In Blue Star, around 30-35% of the sale of goods is through traded goods (which are imported from China or other nations), while earlier the company used to import 90% of its Indoor Unit, now it has started to manufacture on its own as well as started to source from local manufacturers also. The Foreign Exchange outflow of both Blue Star & Voltas is ~5 times that of the forex inflow.

Borrowings
The borrowings of Blue Star stand around Rs 574 Cr & that of Voltas are around Rs 515 Cr as on Sep, 2018. As far as March 18 is concerned, Blue Star had around Rs 371 Cr of borrowings & Voltas had a borrowing of Rs 142 Cr.
While Voltas’ entire borrowing is for meeting its working capital needs, Blue Star has around 93% of its total borrowing for maintaining its Working capital requirements & rest was Non- Current in nature.

Contingent Liabilities
The Contingent Liabilities of Blue Star are around Rs 566.23 Cr, that is around 18% of the total balance sheet size; while contingent liabilities of Voltas stand at around Rs 537 Cr (including Voltas share in its Associates & JV’s liabilities), this forms around 7.34% of its total Balance sheet’s size.

Order Book Position
In FY 13, the order book size of Blue star was of around 6 months sale, while that of Voltas was around sale of 8 months. In FY 18, the order book position of Blue star decreased to around 5 month sales, and that of Voltas increased to 10 month sales.
Working Capital Cycle
The shorter the working capital, the better it is, as lesser amount of funds would be required in order to meet the day to day business requirements. While the working capital cycle of Blue Star is around 31 days, that of Voltas is of just 17 days. Following is the detailed bifurcation of the working capital cycle of both the companies:-
a. Inventory Days: The average inventory days of Blue Star are around 54 days, while that of Voltas is around 56 days. In FY 2019’s first quarter due to weak summer conditions & the onset of early monsoon, there was de growth in the AC sales. Due to which the unsold inventory, increased the average days of inventory & in turn squeezed the margins.
b. Receivables Days: On an average, Blue star receives payment from its Debtors within 82 days, while it takes around 88 days for Voltas to receive its payments. Although, these companies are based on cash & carry model, yet the payments from projects often have a time lag, which leads to an increase in the debtor days of the companies.
c. Payable Days: Longer the payable period, better it is for the company. The average payable period of Voltas stands around 127 days, while that of Blue star is around 106 days.
Total Expenditure
- Raw Material: The raw material forms the major part of the expenditure for both the companies. But on a comparison Blue star allocates lesser amount on raw material as compared to Voltas.
- Power & Fuel Cost: While Voltas spends more on Raw material, it saves on Power & fuel with lesser expenditure as compared to Blue Star Ltd.
- Employee Cost: With larger selling & distribution network Voltas needs to employ more people, hence its expenditure is more than that of Blue Star.
- Manufacturing Expenses: Blue Star has 5 manufacturing facilities currently, while Voltas has 3 manufacturing facilities. Since, Voltas keeps its balance sheet light on assets, its expenditure on maintenance of facilities etc. is also less as compared to Blue Star.
- Selling & Distribution Expenses: Blue star spends more on its marketing activities in order to establish its brand and improve the mind recall of the prospective customers.
- Interest: Blue Star has over the years have had more debt in comparison to Voltas & hence, its expenditure over interest payment is higher.
- Depreciation: Blue Star with its own production lines for various products, is bound to have a higher depreciation in comparison to Voltas.

Return Ratios


Opportunities
- Government’s push on Growth Agenda: The focus of the current government at the Centre is largely on the development & creation of Infrastructure. There is lot of public spending on Road Construction, Water treatment, Rural Electrification, Smart city development and many more projects. As the private sector revives and their capital expenditure increases, giving hopes for increase in the projects business in the coming times.
- Increasing consumer spending: The consumers’ nowadays are extensively spending on capital goods. Further the demand for Unitary products is more from Northern India. Here, Air Conditioners & Air Coolers become necessary in the scorching summer season. Given the low penetration rate of Air Conditioners in India, in comparison to countries like China, the companies are quite optimistic for the rise in demands of such goods.
- Better availability of Power: Now with the governments’ initiative of providing power in every nook & corner of India. With the passage of time and with the improvement in the standard of living of the people there, there is going to be an increase in the demand for cooling products, not only the Air conditioners but the entire segment that includes Air coolers, Water coolers, Chillers, Water Purifiers etc.
- Growth of QSR, Cold Chain facilities: The commercial sector is witnessing a rapid change, with the emergence of quick service restaurants and also due to the perishable nature of most of the food items, the demand for commercial refrigeration is enhancing. Apart from this, chillers etc. are demanded hugely by the Ice cream industry, Cola, Chocolate manufacturers & also by Cold Chains. Nearly 80% of the deep freezers of Blue Star are sold to Ice cream industry, emphasising on the huge absorption capacity of the Ice cream industry.
- Easier availability of Consumer Credit: With the availability of consumer credit, consumers can easily buy Air conditioner, and other capital goods on simple instalments. Also, nearly 40% of the sale of Air conditioners is through financing, provision of credit facilities, discounts & other schemes in off seasons can enhance the sale of such goods.
- Trend towards Inverter AC: With the new BEE norms, the fixed speed AC’s demand has decreased and has paved the way for Inverter AC’s that are more power efficient than the erstwhile 5 star fixed speed AC’s. Companies are gearing their R&D efforts towards bringing breakthrough technological advancements in such products. This is largely being done in order to achieve competitive edge, offer more SKU’s to consumers in terms of features, price, colour options etc and to keep the operating margins high.
- Voltas entry into Capital Goods segment: Last year Voltas had announced its collaboration with Ardutch B.V., a subsidiary of Arcelik A.S., in order to manufacture & market White Gooods under the brand name of ‘Voltas Beko’. The products that are initially launched are Washing Machines, Dishwashers, Microwaves & Refrigerators.
- Investment in Healthcare & Data Security: With the governments focus on Healthcare & Hygiene, Blue Star had bagged Rs 100 Cr order from the UP government for the installation & maintenance of CT scan machineries. Also with the rising security risk of data breaching, companies are heavily investing in Data security thus, benefitting Blue Star Ltd.
Threats
- Weak Private Investment: Over the last few years, the investment made by Private sector has been negligible, due to the cash crunch in the Indian economy. Although, there have been few signs of revival in the private sector, but nothing breakthrough has been achieved as of now. Eg the slowdown in the setting up of new industries, capacity addition in sectors like Textile, Ship building, Mining etc has impacted the companies. In order to mitigate this risk, the companies have started to focus on Government projects owing to the increased budget allocations on the Infrastructure segment.
- Foreign Exchange Fluctuations: Both Voltas & Blue star are highly dependent on the imports of raw material, traded goods etc. from Foreign nations. Companies usually source Compressors, Indoor units and other high end products from China and other nations. In order to reduce their dependence on imports, companies have started to invest in their own manufacturing facilities, as well as started sourcing from local manufacturers. Any fluctuation in the foreign rates can negatively impact the margins.
- Instability in International markets: Most of the international business of both these companies is in the Gulf region. The gulf countries expenditure is directly proportional to the crude oil price. A low crude oil price leads to fall in the public expenditure in such countries. Apart from this, any disturbance in the general macroeconomic conditions in the foreign countries impact the working as well as the profitability of the companies. Eg. The embargo of Qatar has impacted both the companies, and now they’re refraining from taking anymore projects in Qatar.
- Taxation & Legislation: In Sep 2018, Government had enhanced custom duty from earlier 10% to 20% on fully built AC’s that are imported. Along with this, the custom duty on Compressors increased from earlier 7.5% to now 10%. While the individual indoor units that were usually imported singly continue to be taxed at 10%. On the legislation side, any change in the norms like the Energy Efficiency norms can lead to an increase in the cost of production for the companies.
- Sluggishness in the Textile & Mining Industry: The third segment of Voltas that contributes nearly 5% to the turnover is involved in the provision of textile and mining related equipment & machineries. But the sluggishness in these both sectors have impacted the performance of Voltas as well as the transfer of the agency business of Terex Unit Rig/ O&K to Caterpillar dealers has further impacted the revenues. Suspension of EMTA mines due to Supreme Court order for the cancellation of Coal Blocks, and the overall slump in the Mining industry has impacted the workings of Voltas. Although, Blue Star does not directly deal in textile & mining equipment, but it is involved in the setting up of factories etc so is indirectly related to these industries.
- Unfavourable Weather: North India is the main market for Air Coolers & Air Conditioners owing to the harsh summers. But a light summer or the onset of early monsoon leads to fall in the sales volume of these companies. Also, strong summers will bring better monsoons, which in turn leads to more disposable income with people which can be spent by them in the festival season.
- Interest Rate Risk: A rise in the rate of interest not only hampers the net profit margin of the company, but also increases the interest on the consumer credit. Which in turn lead to lesser sale of AC’s & Air Coolers as 40% of the sale is through financing.
- Commodity Price Risk: The basic raw materials for the unitary products are ferrous & non-ferrous metals, which are prone to huge amount of fluctuations. Usually, companies mitigate themselves from this risk, by entering into long term contracts or maintaining inventory in the short term. But a price rise over the long period can shrink the margins of the companies.
- Technology change: A change in technology of production of goods, or in the final goods can impact the performance of the company. As it would make the old technology obsolete & the company would need to invest in new technologies, thus, disturbing the balance sheet as well as the financial performance of the company.
- Competition: The competitive intensity in both the Products & the Projects division is high, thus reducing the scope for frequent price increases. In order to bag new projects, which are based on bidding, companies need to quote very competitive rates. Thus, leading to low margins. While in the Unitary products division, Voltas being the Market leader needs to be wary before taking any price rise, as its next competitor, LG, might take over some of its market share. While Voltas growth in Inverter AC has been good but it has not been able to beat LG which has been able to acquire 53% market share in this particular segment.
To know about our investment advisory services and to place your inquiries: Drop us a mail at – info@pawealth.in or Visit pawealth.in

References:
Companies’ Annual reports, Media reports, Investor presentations, Industry reports. (We have taken the most recent published details of the companies and the latest investors’ meet)
Disclaimer:
The report only represents personal opinions and views of the author. No part of the report should be considered as recommendation for buying/selling any stock. The report & references mentioned are only for information of the readers about the industry stated.

great research, can voltas be bought at these levels?
Thanks. For a specific long term view, get in touch with our team at 9988275566. Available on whatsapp as well.