

What Is the 200-Week Moving Average, and Why Does It Matter?
200-week moving average (200-WMA): The average of an index’s last 200 weekly closing prices, covering roughly 3.8 years of trading. Because it smooths out an entire market cycle, it works as a gauge of the long-term trend.
Touch event: The first weekly close at or below the average after the index had been trading above it. Forward returns in this study are measured from that touch close and are price returns, which exclude dividends.
The Core Rule: A close below a multi-year average is rare, and rare events have historically marked the deep corrections that long-term investors later looked back on as opportunities.
Where the Nifty Stands Today
The Nifty 50 closed at 22,383 against a 200-week average of 22,607, which is about 1% below it. That is roughly 15% below its January 2026 peak of 26,329. The index had already slipped under its 50-week average (24,532 today) on 6 March 2026, and the six months that followed returned about -2.3% from that touch close.
The Sensex has confirmed the signal. It closed at 73,896 on 25 September 2026, about 0.6% below its own 200-week average of 74,311.
Earnings tell a different story from prices. As per PA Wealth’s 1 October 2026 note, the Nifty Midcap 150 reported a median quarterly year-on-year sales growth of 17.5% and a median profit growth of 22.09%. Separately, 38 of the 50 Nifty stocks were trading 15% or more below their 52-week highs. Earnings have kept rising while prices have fallen.
What Happened After Every Nifty Touch Since 1995
The table below shows all seven earlier touches of the 200-week average and the price return from the touch close.
| Touch Date | Nifty Close | 1 Year | 3 Years | 5 Years |
|---|---|---|---|---|
| Mar 2001 | 1,161 | -2% | +50% | +182% |
| Mar 2002 | 1,170 | -15% | +80% | +208% |
| Oct 2008 | 3,280 | +51% | +56% | +86% |
| Aug 2011 | 4,748 | +13% | +68% | +81% |
| Nov 2011 | 4,710 | +19% | +82% | +72% |
| Dec 2011 | 4,652 | +26% | +77% | +75% |
| Mar 2020 | 9,955 | +51% | +72% | +125% |
| Median of all 7 | +19.5% | +71.8% | +85.9% |
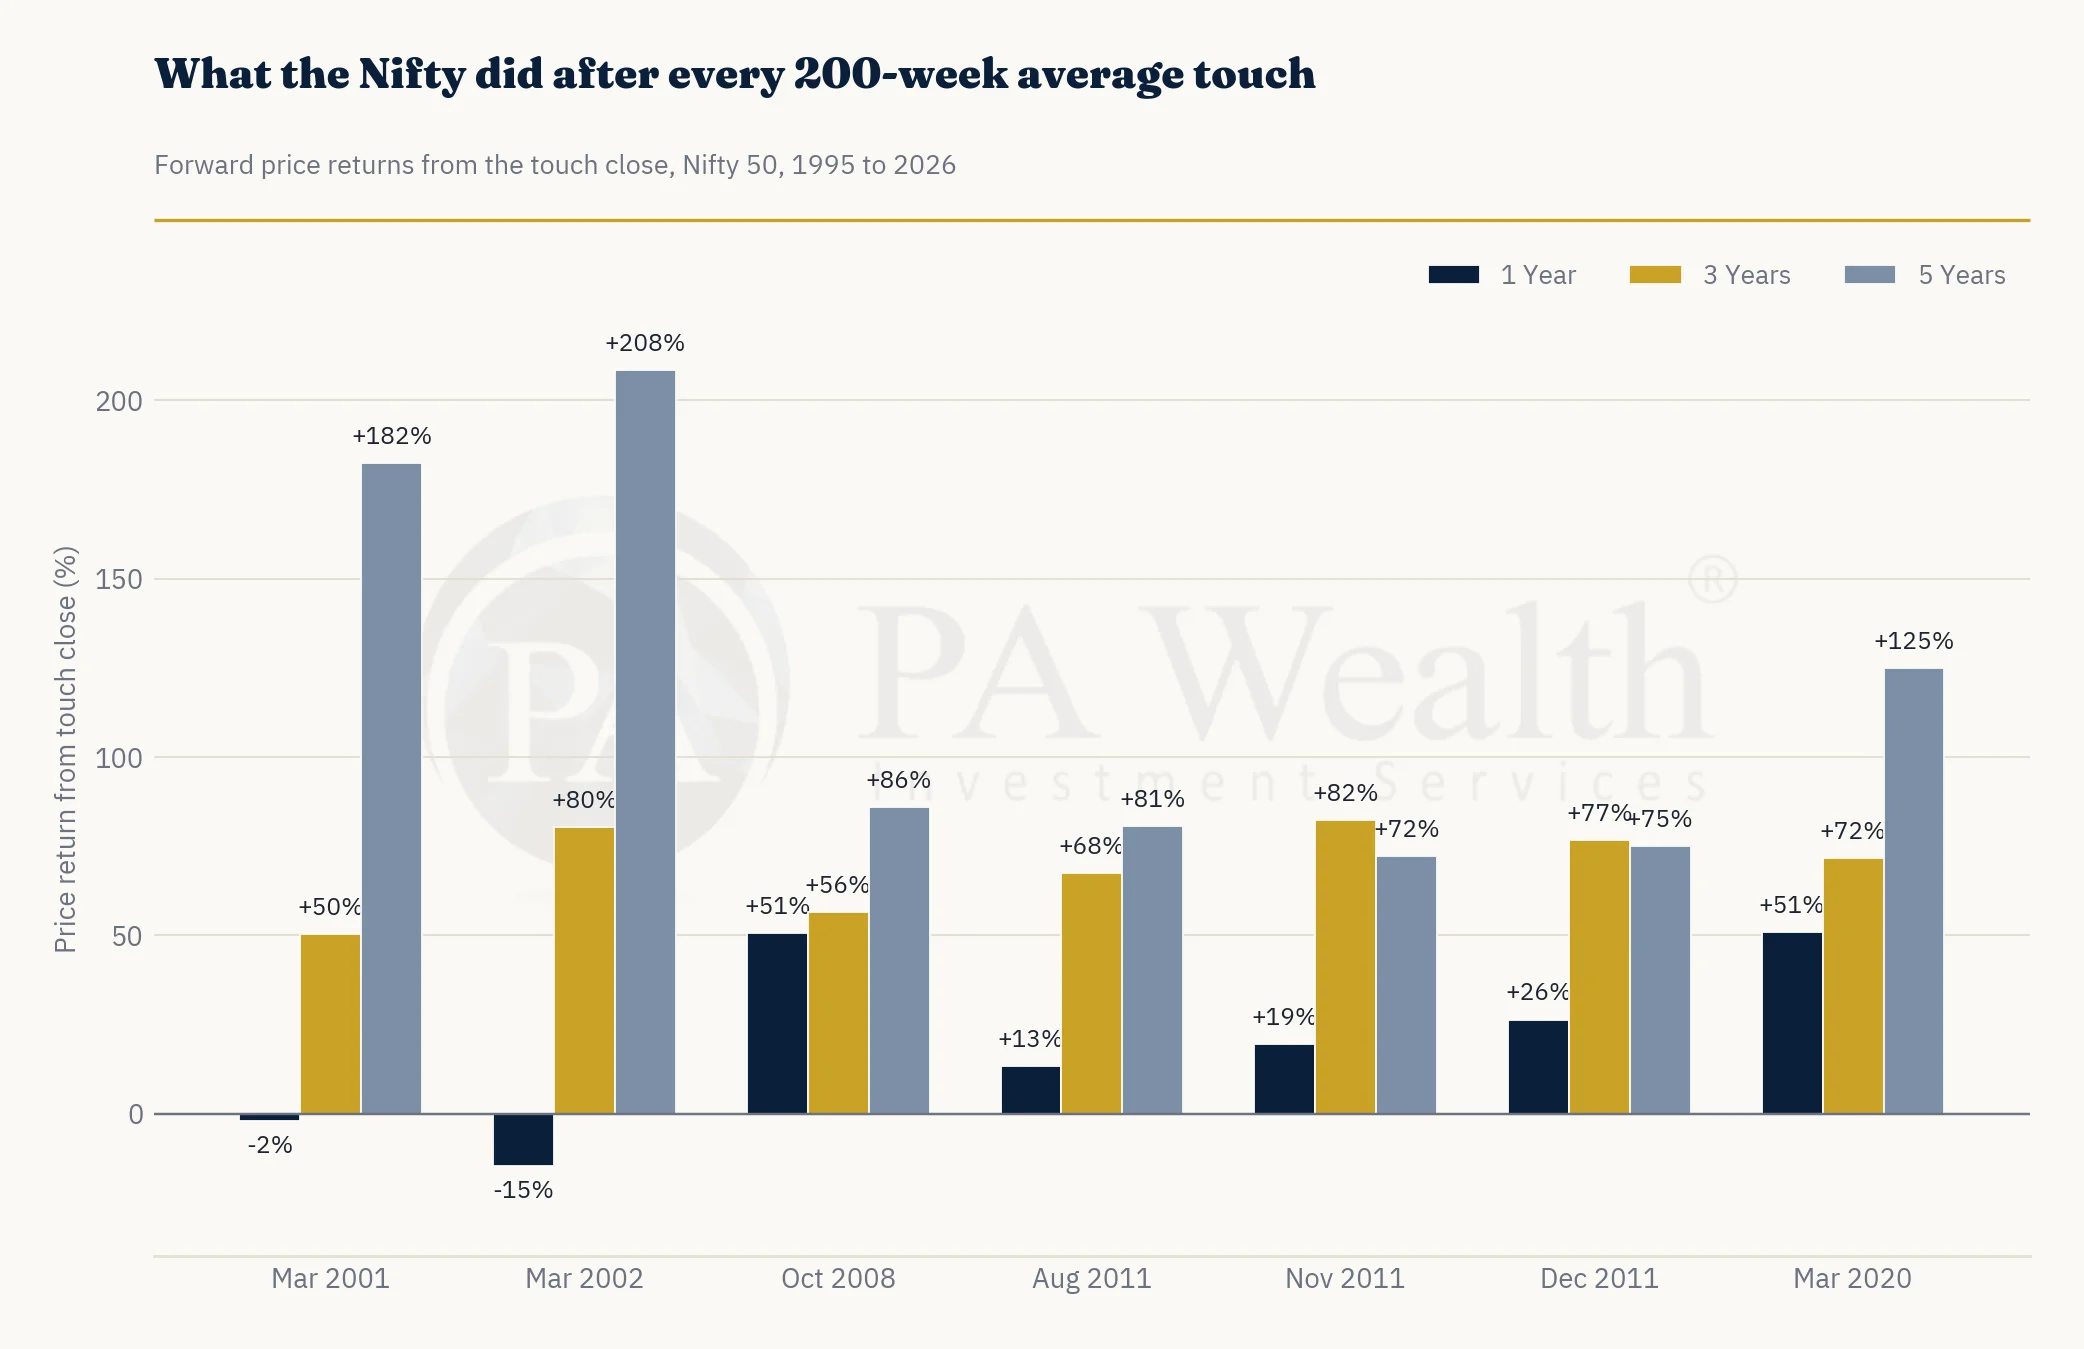
Three-year and five-year returns were positive in all seven cases, ranging from +50% to +82% over three years and from +72% to +208% over five. One-year returns were positive in five of seven.
The Key Takeaway: The payoff came over years, not weeks. The two negative one-year outcomes, in 2001 and 2002, still turned into gains of 50% and 80% over the next three years.
Why the Rare Signal Has Been More Powerful Than the Common One
Not every moving average carries the same weight. The 50-week average is touched often and the results are mixed. The 200-week average is touched rarely and the results have been stronger. The 50-month average, a deeper long-term gauge, has triggered only four times.
| Signal | Touches | Avg 1 Year | Avg 3 Years | Avg 5 Years | 1 Year Win Rate |
|---|---|---|---|---|---|
| 50-week average | 43 | +16.4% | +56.4% | +113.8% | 76% |
| 200-week average | 7 | +20.7% | +69.4% | +118.5% | 71% |
| 50-month average | 4 | +38.6% | +79.6% | +139.6% | 75% |
| 200-month average | 0 | NA | NA | NA | NA |
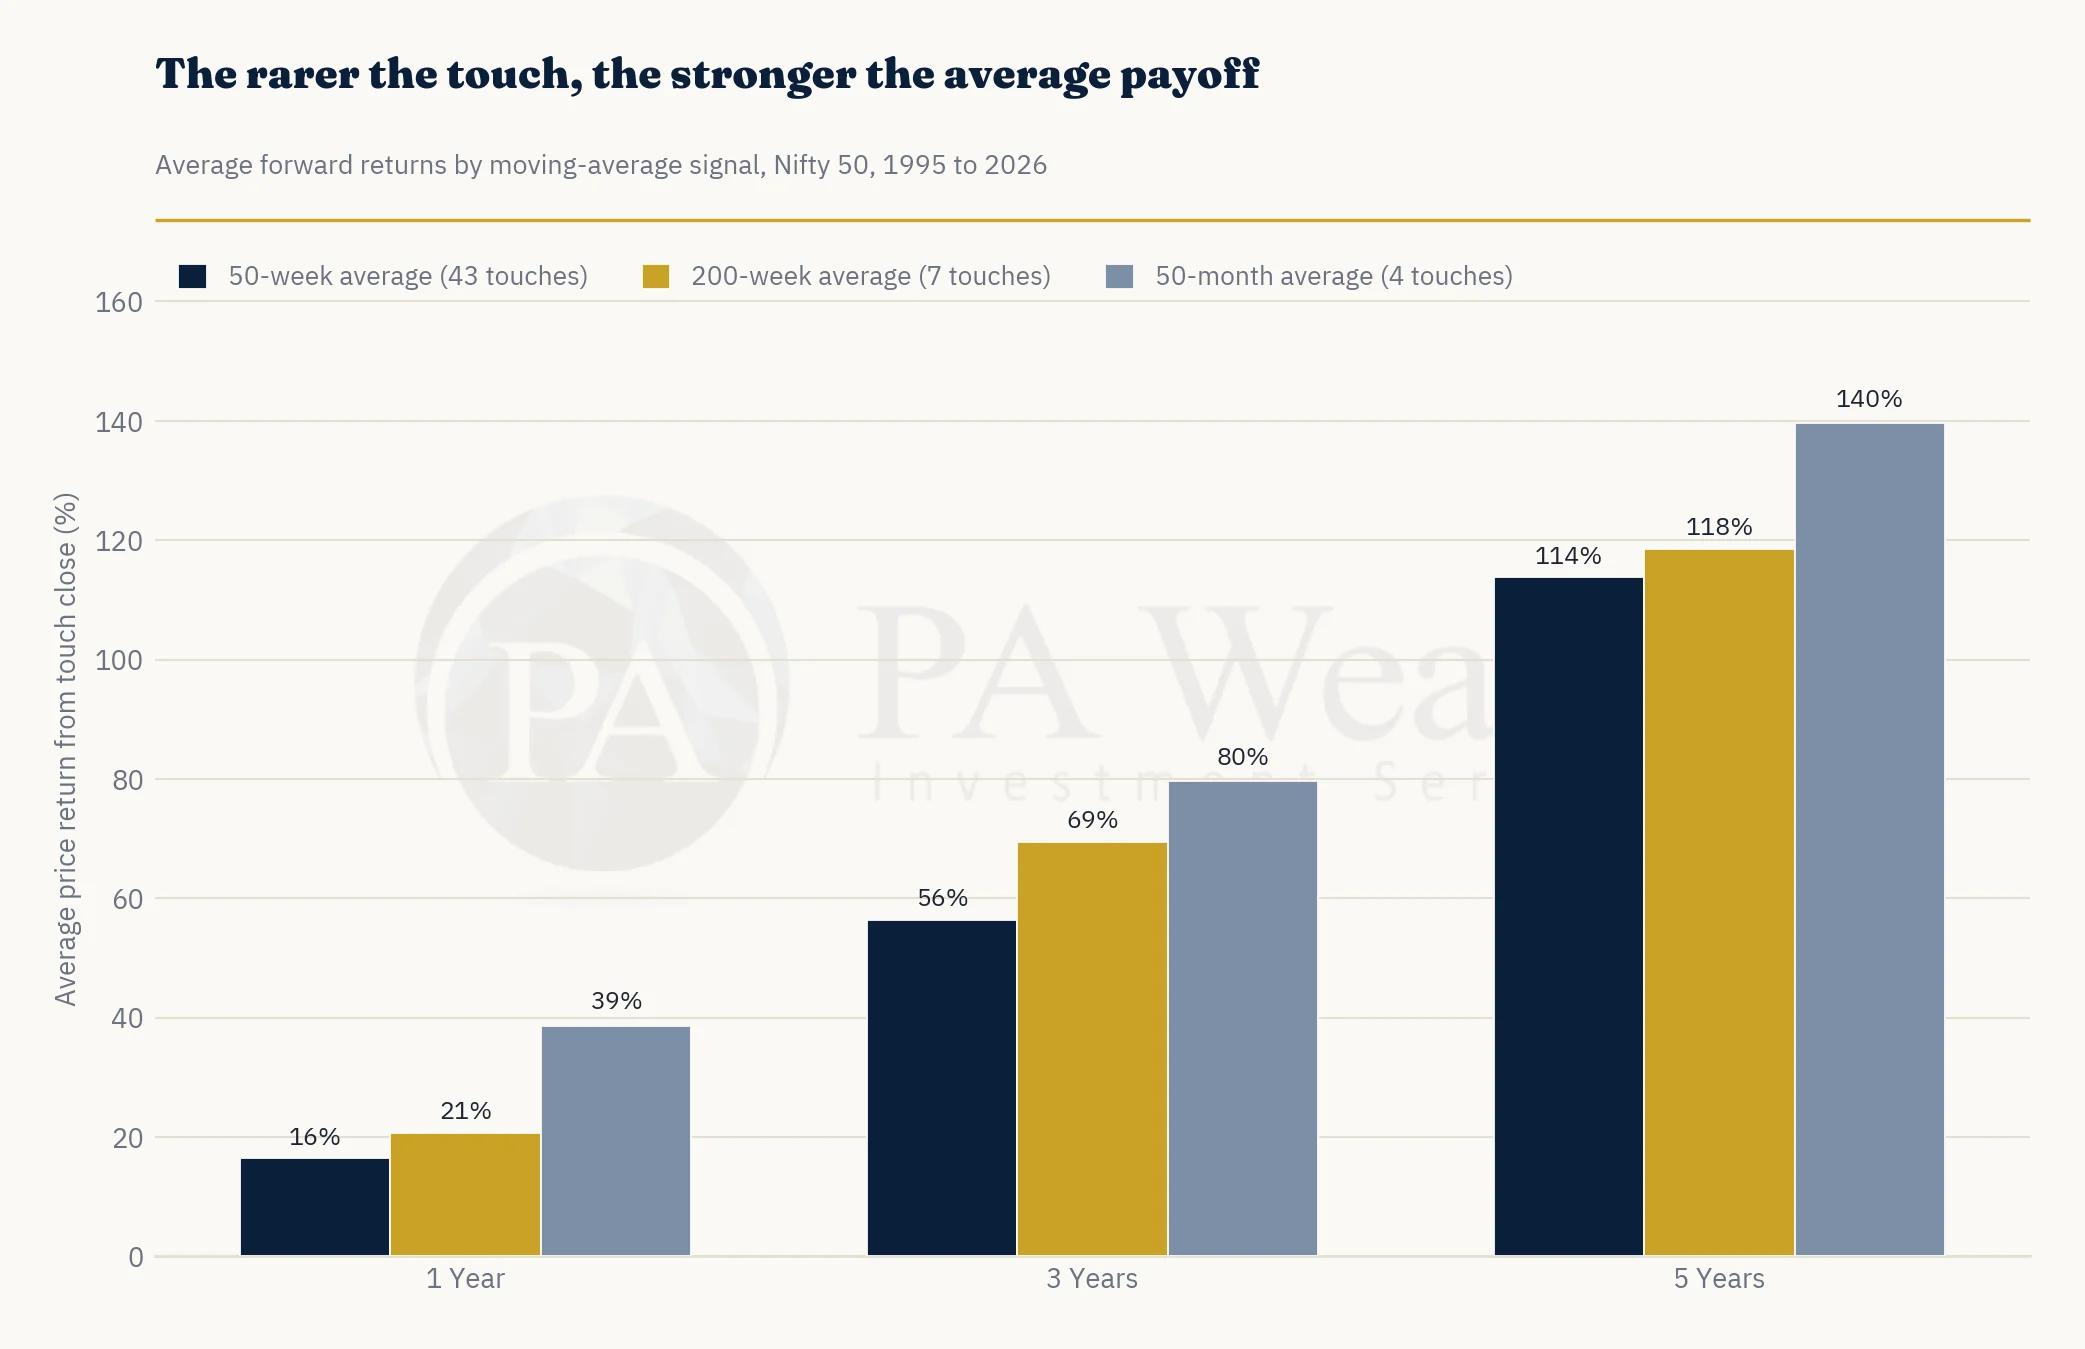 The 50-week average also carries a warning. Of its 42 touches with a measurable one-year return, 10 were negative, and the worst, in March 2008, was followed by a fall of about 45% over the next year. The Nifty has never closed at or below its 200-month average, and in this dataset the 50-month signal has not triggered since March 2020.
The Sensex Tells a More Mixed Story
The Sensex has 47 years of data, which makes it a useful cross-check. It has touched its 200-week average on 21 earlier occasions with measurable returns. The outcomes are favourable more often than not, but less uniformly than the Nifty’s smaller sample suggests.
| Horizon | Sensex Positive | Sensex Median | Nifty Positive | Nifty Median |
|---|---|---|---|---|
| 1 Year | 14 of 21 | +18.3% | 5 of 7 | +19.5% |
| 3 Years | 19 of 21 | +46.8% | 7 of 7 | +71.8% |
| 5 Years | 16 of 21 | +73.9% | 7 of 7 | +85.9% |
All five Sensex touches that were negative after five years came between 1996 and 1998, a prolonged bear phase around the Asian financial crisis. That is a useful reminder that the signal has not worked in every episode.
The Bottom Line
The Nifty has closed below its 200-week average, a level it had touched only seven times in the last three decades. In every earlier instance, the index was higher after three and five years, and in five of seven it was higher after one year. The Sensex adds a more cautious note, with weaker outcomes in the late 1990s.
With earnings still growing and a large share of Nifty stocks well below their highs, prices appear to have moved ahead of fundamentals on the downside. History suggests the reward has gone to patient investors who stayed invested through the uncertainty. Think in years, not weeks.
Disclaimer: This article is for educational and informational purposes only and should not be treated as investment advice or a recommendation to buy or sell any security. Past performance does not guarantee future results. Investments in securities markets are subject to market risks. Read all related documents carefully before investing. Registration granted by SEBI and certification from NISM in no way guarantee the performance of the intermediary or provide any assurance of returns to investors.